Industries
Business Distribution by Industry in Mutki
| Industry Description | Number of Establishments |
|---|---|
| Education | 32 |
| Public administration | 13 |
| Gas station | 10 |
Mutki Facts
| Area | 1093.4 km² |
| Population | 30,468 |
| Male Population | 15,395 (50.5%) |
| Female Population | 15,073 (49.5%) |
| Population change (1975 to 2020) | +42.1% |
| Population change (2000 to 2020) | -1.0% |
| Median Age | 17.4 years (Male: 17, Female: 17.8) |
| Neighborhoods | Pınarbaşı Mahallesi, İkizler Köyü, Salman Köyü, Kavakbaşı Uran Köyü, Uğur Mezrası İkizler Köyü |
| Local Time | |
| Timezone | Türkiye Standard Time |
| Lat & Lng | 38.40624, 41.92018 |
| Postal Codes | 13700, 13702 |
Map of Mutki
Interactive Map
Mutki Population
Years 1975 to 2020
| Data | 1975 | 1990 | 2000 | 2015 | 2020 |
|---|---|---|---|---|---|
| Population | 21,443 | 33,014 | 30,768 | 29,140 | 30,468 |
| Population Density | 19.6 / km² | 30.2 / km² | 28.1 / km² | 26.7 / km² | 27.9 / km² |
Mutki Population change from 2000 to 2015
Decrease of 5.3% from year 2000 to 2015
| Location | Change since 1975 | Change since 1990 | Change since 2000 |
|---|---|---|---|
| Mutki | +35.9% | -11.7% | -5.3% |
| Bitlis Province | +20.6% | -8.6% | -8.5% |
| Turkey | +102.3% | +46.5% | +24.7% |
Mutki Median Age
Median Age: 17.4 years
| Location | Median Age | Median Age (Female) | Median Age (Male) |
|---|---|---|---|
| Mutki | 17.4 yrs | 17.8 yrs | 17 yrs |
| Bitlis Province | 19.6 yrs | 19.8 yrs | 19.4 yrs |
| Turkey | 29.3 yrs | 29.8 yrs | 28.7 yrs |
Mutki Population Density
Population Density: 27.9 / km²
| Location | Population | Area | Density |
|---|---|---|---|
| Mutki | 30,468 | 1,093.4 km² | 27.9 / km² |
| Bitlis Province | 304,521 | 8,245 km² | 36.9 / km² |
| Turkey | 77.8 million | 780,782.9 km² | 99.6 / km² |
Mutki Historical and Projected Population
Estimated Population from 0 to 2100
- JRC (European Commission's Joint Research Centre) work on the GHS built-up grid
- CIESIN (Center for International Earth Science Information Network)
- [Link] Klein Goldewijk, K., Beusen, A., Doelman, J., and Stehfest, E.: Anthropogenic land use estimates for the Holocene – HYDE 3.2, Earth Syst. Sci. Data, 9, 927–953, https://doi.org/10.5194/essd-9-927-2017, 2017.
Neighborhoods in Mutki
Percentage of businesses by neighborhood in Mutki
Price Distribution
Business distribution by price for Mutki
Human Development Index (HDI)
Statistic composite index of life expectancy, education, and per capita income.
Mutki CO2 Emissions
Carbon Dioxide (CO2) Emissions Per Capita in Tonnes Per Year
| Location | CO2 Emissions | CO2 Emissions Per Capita | CO2 Emissions Intensity |
|---|---|---|---|
| Mutki | 130,827 tn | 4.29 tn | 119.7 tons/km² |
| Bitlis Province | 1,309,761 tn | 4.3 tn | 158.9 tons/km² |
| Turkey | 435,645,812 tn | 5.6 tn | 558 tons/km² |
| 2013 CO2 emissions (tonnes/year) | 130,827 tn |
| 2013 CO2 emissions (tonnes/year) per capita | 4.29 tn |
| 2013 CO2 emissions intensity (tonnes/km²/year) | 119.7 tons/km² |
Natural Hazards Risk
Relative risk out of 10
| Hazard | Risk Level |
|---|---|
| Drought | High (9) |
| Earthquake | High (10) |
| Landslide | High (9) |
* Risk, particularly concerning flood or landslide, may not be for the entire area.
- Dilley, M., R.S. Chen, U. Deichmann, A.L. Lerner-Lam, M. Arnold, J. Agwe, P. Buys, O. Kjekstad, B. Lyon, and G. Yetman. 2005. Natural Disaster Hotspots: A Global Risk Analysis. Washington, D.C.: World Bank. https://doi.org/10.1596/0-8213-5930-4.
- Center for Hazards and Risk Research - CHRR - Columbia University, Center for International Earth Science Information Network - CIESIN - Columbia University, and Norwegian Geotechnical Institute - NGI. 2005. Global Landslide Hazard Distribution. Palisades, NY: NASA Socioeconomic Data and Applications Center (SEDAC). https://doi.org/10.7927/H4P848VZ.
- Center for Hazards and Risk Research - CHRR - Columbia University, Center for International Earth Science Information Network - CIESIN - Columbia University, and International Research Institute for Climate and Society - IRI - Columbia University. 2005. Global Drought Hazard Frequency and Distribution. Palisades, NY: NASA Socioeconomic Data and Applications Center (SEDAC). https://doi.org/10.7927/H4VX0DFT.
- Center for Hazards and Risk Research - CHRR - Columbia University, Center for International Earth Science Information Network - CIESIN - Columbia University. 2005. Global Earthquake Hazard Distribution - Peak Ground Acceleration. Palisades, NY: NASA Socioeconomic Data and Applications Center (SEDAC). https://doi.org/10.7927/H4BZ63ZS.
Recent Nearby Earthquakes
Magnitude 3.0 and greater
| Date▼ | Time↕ | Magnitude↕ | Distance↕ | Depth↕ | Location↕ | Link |
|---|---|---|---|---|---|---|
| 8/12/19 | 1:34 PM | 4.1 | 89.7 km | 9,750 m | 11km E of Hazro, Turkey | usgs.gov |
| 5/23/18 | 10:10 PM | 4 | 38.7 km | 10,000 m | 10km WNW of Hizan, Turkey | usgs.gov |
| 5/1/17 | 4:30 PM | 4.5 | 92.2 km | 10,000 m | 15km WSW of Gevas, Turkey | usgs.gov |
| 10/23/16 | 8:22 AM | 4.2 | 11 km | 10,000 m | 5km WSW of Bitlis, Turkey | usgs.gov |
| 1/23/16 | 7:53 AM | 4.3 | 78.8 km | 10,910 m | 8km NNE of Begendik, Turkey | usgs.gov |
| 2/4/15 | 2:48 AM | 4 | 82.7 km | 6,000 m | 7km ENE of Begendik, Turkey | usgs.gov |
| 1/21/15 | 1:58 PM | 4.5 | 84 km | 4,000 m | 14km NNE of Bahcesaray, Turkey | usgs.gov |
| 10/30/14 | 2:35 PM | 4.3 | 43.4 km | 5,000 m | 22km NNE of Guroymak, Turkey | usgs.gov |
| 9/17/13 | 8:40 PM | 5 | 78 km | 5,330 m | 16km S of Varto, Turkey | usgs.gov |
| 9/16/13 | 10:31 AM | 4.1 | 79.8 km | 6,500 m | 18km S of Varto, Turkey | usgs.gov |
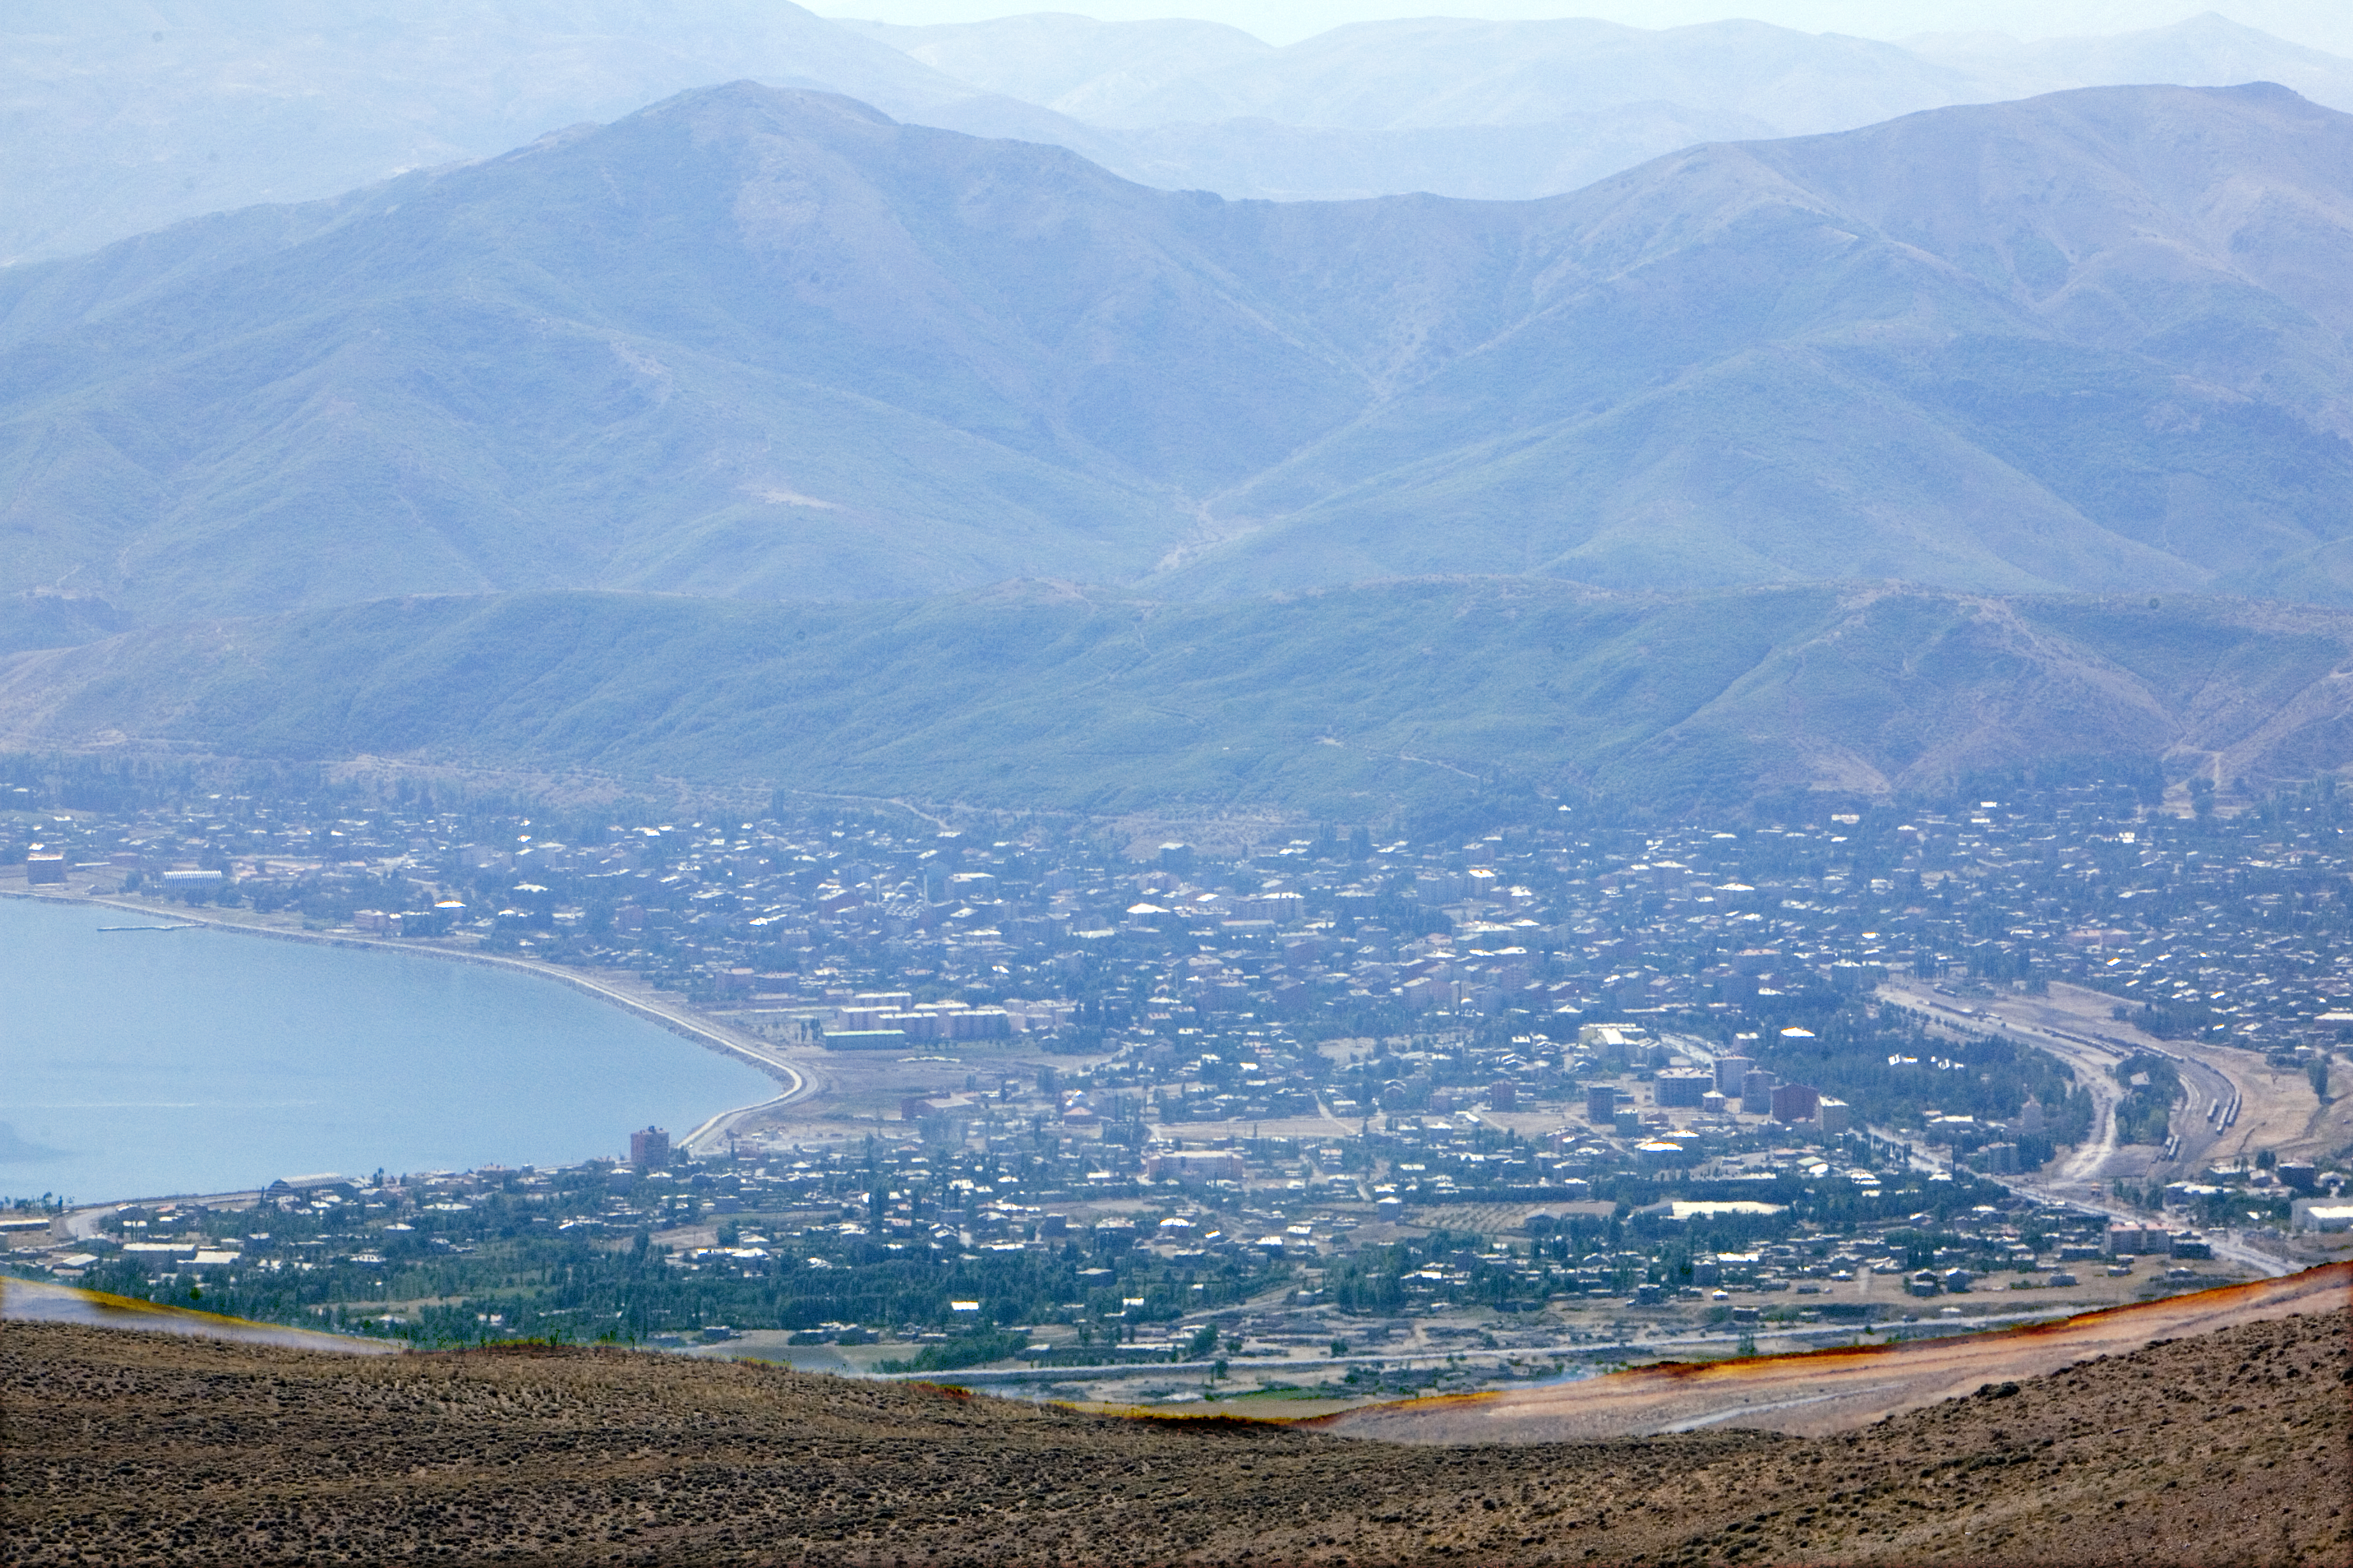
Mutki
Mutki or Motkî is a town and district of Bitlis Province, Turkey. The mayor is Özcan Birlik (BDP).
Mutki Wikipedia Page

About Our Data
The data on this page is estimated using a number of publicly available tools and resources. It is provided without warranty, and could contain inaccuracies. Use at your own risk.