Tunduma Facts
| Area | 80.6 km² |
| Population | 186,173 |
| Male Population | 89,450 (48.0%) |
| Female Population | 96,723 (52.0%) |
| Population change (1975 to 2020) | +468.8% |
| Population change (2000 to 2020) | +100.8% |
| Median Age | 18.7 years (Male: 19.1, Female: 18.4) |
| Local Time | |
| Timezone | East Africa Time |
| Lat & Lng | -9.30000, 32.76667 |
Map of Tunduma
Interactive Map
Tunduma Population
Years 1975 to 2020
| Data | 1975 | 1990 | 2000 | 2015 | 2020 |
|---|---|---|---|---|---|
| Population | 32,731 | 69,619 | 92,696 | 162,273 | 186,173 |
| Population Density | 406.3 / km² | 864.2 / km² | 1,150.6 / km² | 2,014.2 / km² | 2,310.9 / km² |
Tunduma Population change from 2000 to 2015
Increase of 75.1% from year 2000 to 2015
| Location | Change since 1975 | Change since 1990 | Change since 2000 |
|---|---|---|---|
| Tunduma | +395.8% | +133.1% | +75.1% |
| Mbeya Region | +253% | +113.5% | +57.9% |
| Tanzania | +234.9% | +110.2% | +57.4% |
Tunduma Median Age
Median Age: 18.7 years
| Location | Median Age | Median Age (Female) | Median Age (Male) |
|---|---|---|---|
| Tunduma | 18.7 yrs | 18.4 yrs | 19.1 yrs |
| Mbeya Region | 18 yrs | 18.6 yrs | 17.3 yrs |
| Tanzania | 17.7 yrs | 18.2 yrs | 17.1 yrs |
Tunduma Population Density
Population Density: 2,311 / km²
| Location | Population | Area | Density |
|---|---|---|---|
| Tunduma | 186,173 | 80.6 km² | 2,311 / km² |
| Mbeya Region | 3.2 million | 59,620.7 km² | 54.1 / km² |
| Tanzania | 53.2 million | 940,193.6 km² | 56.6 / km² |
Tunduma Historical and Projected Population
Estimated Population from 1880 to 2100
- JRC (European Commission's Joint Research Centre) work on the GHS built-up grid
- CIESIN (Center for International Earth Science Information Network)
- [Link] Klein Goldewijk, K., Beusen, A., Doelman, J., and Stehfest, E.: Anthropogenic land use estimates for the Holocene – HYDE 3.2, Earth Syst. Sci. Data, 9, 927–953, https://doi.org/10.5194/essd-9-927-2017, 2017.
Price Distribution
Business distribution by price for Tunduma
Human Development Index (HDI)
Statistic composite index of life expectancy, education, and per capita income.
Tunduma CO2 Emissions
Carbon Dioxide (CO2) Emissions Per Capita in Tonnes Per Year
| Location | CO2 Emissions | CO2 Emissions Per Capita | CO2 Emissions Intensity |
|---|---|---|---|
| Tunduma | 54,787 tn | 0.29 tn | 680.1 tons/km² |
| Mbeya Region | 917,006 tn | 0.28 tn | 15.4 tons/km² |
| Tanzania | 13,721,720 tn | 0.26 tn | 14.6 tons/km² |
| 2013 CO2 emissions (tonnes/year) | 54,787 tn |
| 2013 CO2 emissions (tonnes/year) per capita | 0.29 tn |
| 2013 CO2 emissions intensity (tonnes/km²/year) | 680.1 tons/km² |
Natural Hazards Risk
Relative risk out of 10
| Hazard | Risk Level |
|---|---|
| Drought | Medium (7) |
| Earthquake | Medium (4) |
* Risk, particularly concerning flood or landslide, may not be for the entire area.
- Dilley, M., R.S. Chen, U. Deichmann, A.L. Lerner-Lam, M. Arnold, J. Agwe, P. Buys, O. Kjekstad, B. Lyon, and G. Yetman. 2005. Natural Disaster Hotspots: A Global Risk Analysis. Washington, D.C.: World Bank. https://doi.org/10.1596/0-8213-5930-4.
- Center for Hazards and Risk Research - CHRR - Columbia University, Center for International Earth Science Information Network - CIESIN - Columbia University, and International Research Institute for Climate and Society - IRI - Columbia University. 2005. Global Drought Hazard Frequency and Distribution. Palisades, NY: NASA Socioeconomic Data and Applications Center (SEDAC). https://doi.org/10.7927/H4VX0DFT.
- Center for Hazards and Risk Research - CHRR - Columbia University, Center for International Earth Science Information Network - CIESIN - Columbia University. 2005. Global Earthquake Hazard Distribution - Peak Ground Acceleration. Palisades, NY: NASA Socioeconomic Data and Applications Center (SEDAC). https://doi.org/10.7927/H4BZ63ZS.
Recent Nearby Earthquakes
Magnitude 3.0 and greater
| Date▼ | Time↕ | Magnitude↕ | Distance↕ | Depth↕ | Location↕ | Link |
|---|---|---|---|---|---|---|
| 2/2/19 | 7:29 AM | 4.3 | 75.5 km | 10,000 m | 54km NW of Mlowo, Tanzania | usgs.gov |
| 1/17/18 | 6:57 AM | 4.7 | 72.1 km | 10,000 m | 50km ESE of Laela, Tanzania | usgs.gov |
| 3/6/10 | 8:00 PM | 4.6 | 56.2 km | 10,000 m | Lake Rukwa region, Tanzania | usgs.gov |
| 8/17/01 | 2:10 AM | 4.6 | 61.3 km | 10,000 m | Lake Malawi region | usgs.gov |
| 8/2/96 | 9:49 AM | 4.1 | 97 km | 10,000 m | Tanzania | usgs.gov |
| 11/16/94 | 1:08 AM | 4.4 | 82 km | 10,000 m | Lake Malawi region | usgs.gov |
| 1/12/88 | 11:40 AM | 4.7 | 59.9 km | 10,000 m | Lake Rukwa region, Tanzania | usgs.gov |
| 9/3/85 | 4:42 PM | 5.1 | 54.8 km | 33,000 m | Lake Rukwa region, Tanzania | usgs.gov |
| 11/25/84 | 3:42 PM | 4.6 | 65.5 km | 10,000 m | Lake Rukwa region, Tanzania | usgs.gov |
| 10/24/84 | 9:45 PM | 4.1 | 78 km | 10,000 m | Lake Malawi region | usgs.gov |
Tunduma
Tunduma is a border town between Tanzania and Zambia. It lies in Tanzania, in the Mbeya Region. It has border posts for both the Tanzam Highway and the TAZARA railway (for which it has a station) linking the two countries. It is 113 km south-west of ..
Tunduma Wikipedia Page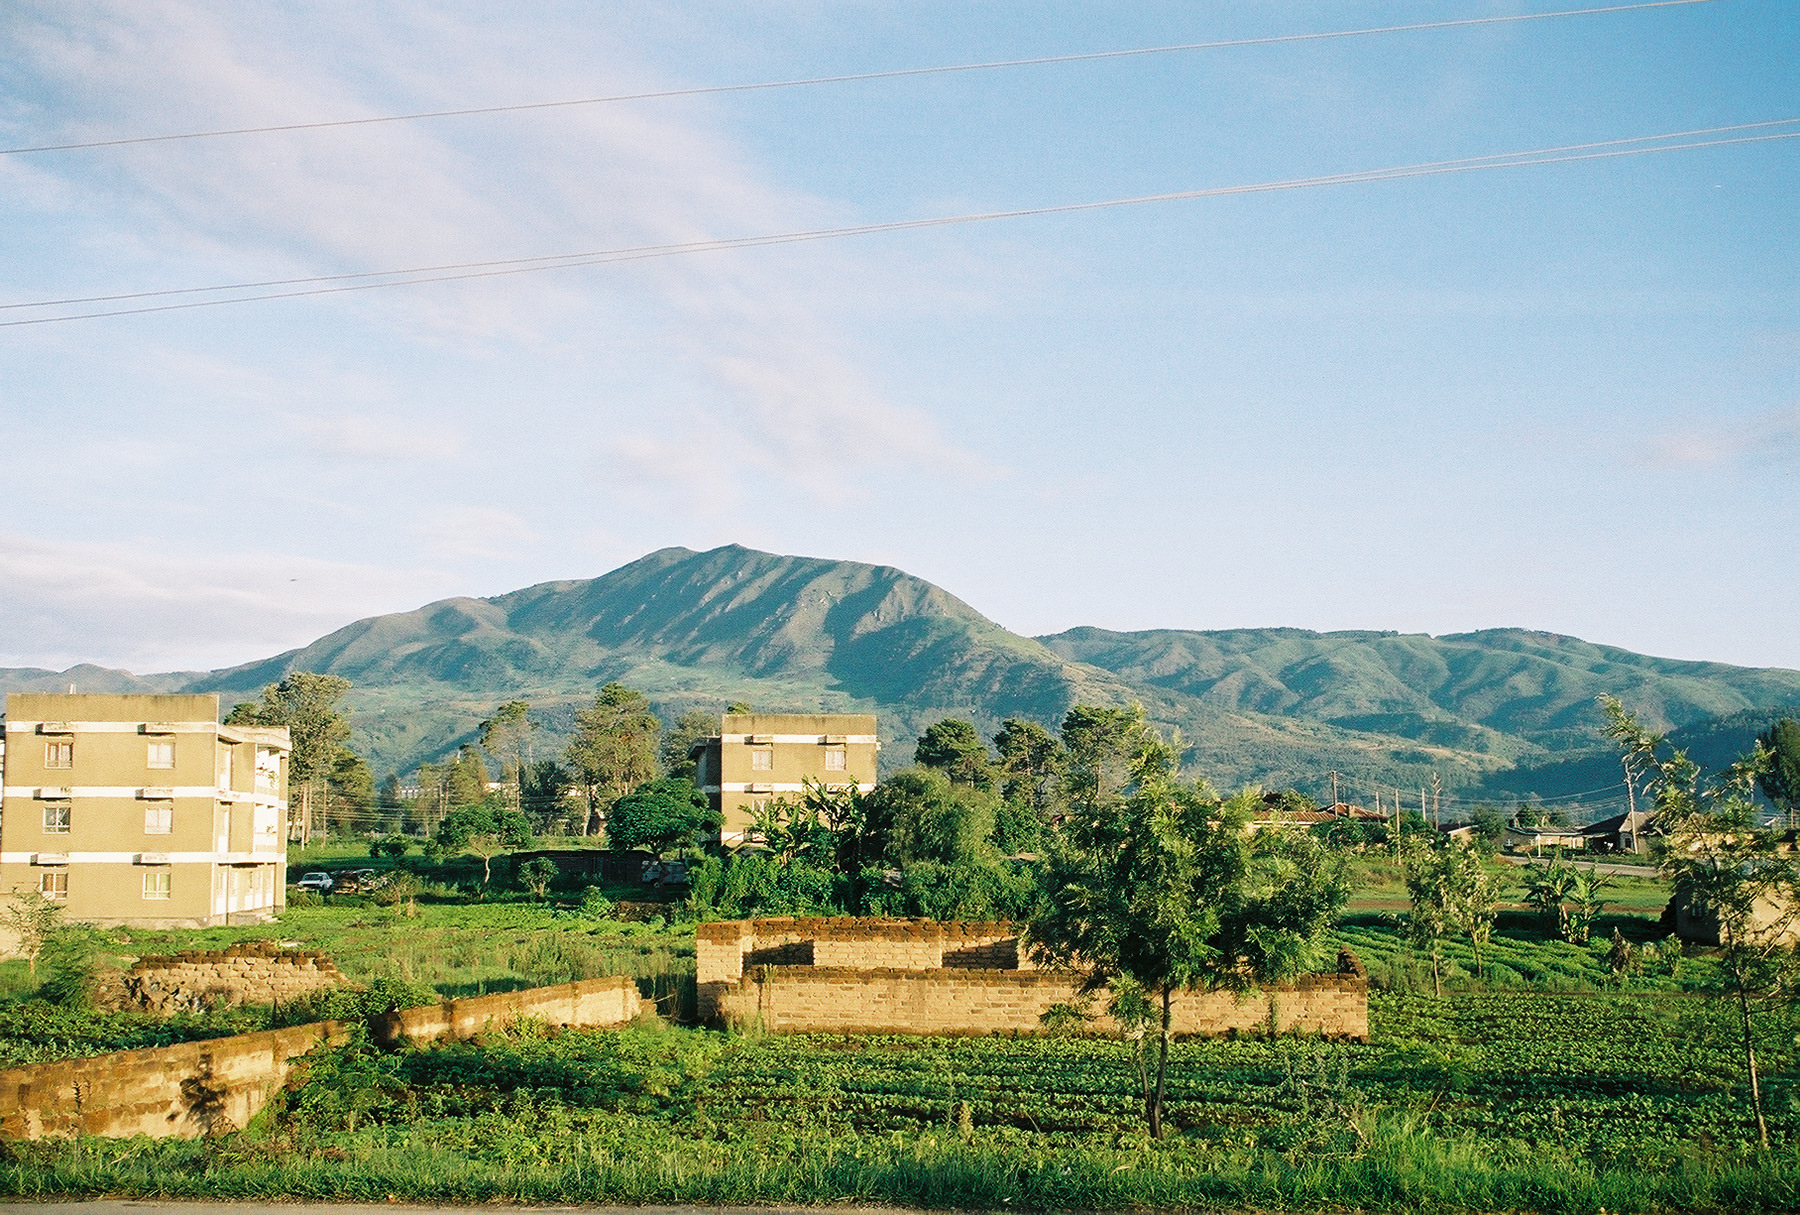

About Our Data
The data on this page is estimated using a number of publicly available tools and resources. It is provided without warranty, and could contain inaccuracies. Use at your own risk.