Categories in Ternopil
Industries
Business Distribution by Industry in Ternopil
| Industry Description | Number of Establishments | Average Age of Business |
|---|---|---|
| Shopping | 835 | 27 years |
| Corporate management | 496 | 16 years |
| Grocery stores and supermarkets | 354 | — |
| Churches | 334 | — |
| Car repair | 332 | — |
| Education | 310 | — |
| Beauty salons | 285 | — |
| Pharmacies and drug stores | 285 | — |
| Restaurants | 267 | — |
| Wholesale of construction supplies | 257 | 18 years |
| Religion | 252 | — |
| Clothing stores | 247 | — |
| Furniture stores | 244 | — |
Ternopil Facts
| Area | 34.9 km² |
| Population | 171,319 |
| Male Population | 79,236 (46.3%) |
| Female Population | 92,083 (53.7%) |
| Population change (1975 to 2020) | -7.3% |
| Population change (2000 to 2020) | -8.3% |
| Median Age | 38.7 years (Male: 35.9, Female: 41.4) |
| Area Codes | 35, 352 |
| Neighborhoods | Дружба, Східний, Промисловий, Сонячний, Поділ |
| Local Time | |
| Timezone | Eastern European Summer Time |
| Lat & Lng | 49.55589, 25.60556 |
| Postal Codes | 46000, 46001, 46002, 46003, 46005, More |
Map of Ternopil
Interactive Map
Ternopil Population
Years 1975 to 2020
| Data | 1975 | 1990 | 2000 | 2015 | 2020 |
|---|---|---|---|---|---|
| Population | 184,839 | 207,042 | 186,753 | 171,940 | 171,319 |
| Population Density | 5,300 / km² | 5,936.7 / km² | 5,354.9 / km² | 4,930.2 / km² | 4,912.4 / km² |
Ternopil Population change from 2000 to 2015
Decrease of 7.9% from year 2000 to 2015
| Location | Change since 1975 | Change since 1990 | Change since 2000 |
|---|---|---|---|
| Ternopil | -7% | -17% | -7.9% |
| Ternopil Oblast | -5.9% | -12% | -7.8% |
| Ukraine | -8.6% | -13.1% | -8.3% |
Ternopil Median Age
Median Age: 38.7 years
| Location | Median Age | Median Age (Female) | Median Age (Male) |
|---|---|---|---|
| Ternopil | 38.7 yrs | 41.4 yrs | 35.9 yrs |
| Ternopil Oblast | 38.7 yrs | 41.4 yrs | 35.8 yrs |
| Ukraine | 39.7 yrs | 43 yrs | 36.5 yrs |
Ternopil Population Density
Population Density: 4,912 / km²
| Location | Population | Area | Density |
|---|---|---|---|
| Ternopil | 171,319 | 34.9 km² | 4,912 / km² |
| Ternopil Oblast | 1.1 million | 13,820.1 km² | 77.6 / km² |
| Ukraine | 42.3 million | 574,117.9 km² | 73.8 / km² |
Ternopil Historical and Projected Population
Estimated Population from 1790 to 2100
- JRC (European Commission's Joint Research Centre) work on the GHS built-up grid
- CIESIN (Center for International Earth Science Information Network)
- [Link] Klein Goldewijk, K., Beusen, A., Doelman, J., and Stehfest, E.: Anthropogenic land use estimates for the Holocene – HYDE 3.2, Earth Syst. Sci. Data, 9, 927–953, https://doi.org/10.5194/essd-9-927-2017, 2017.
Neighborhoods in Ternopil
Percentage of businesses by neighborhood in Ternopil
Postal Codes
Percentage of businesses by Postal Codes in Ternopil
Price Distribution
Business distribution by price for Ternopil
Human Development Index (HDI)
Statistic composite index of life expectancy, education, and per capita income.
Ternopil CO2 Emissions
Carbon Dioxide (CO2) Emissions Per Capita in Tonnes Per Year
| Location | CO2 Emissions | CO2 Emissions Per Capita | CO2 Emissions Intensity |
|---|---|---|---|
| Ternopil | 793,777 tn | 4.63 tn | 22,760.6 tons/km² |
| Ternopil Oblast | 4,553,830 tn | 4.25 tn | 329.5 tons/km² |
| Ukraine | 197,794,396 tn | 4.67 tn | 344.5 tons/km² |
| 2013 CO2 emissions (tonnes/year) | 793,777 tn |
| 2013 CO2 emissions (tonnes/year) per capita | 4.63 tn |
| 2013 CO2 emissions intensity (tonnes/km²/year) | 22,760.6 tons/km² |
Natural Hazards Risk
Relative risk out of 10
| Hazard | Risk Level |
|---|---|
| Earthquake | Low (2) |
* Risk, particularly concerning flood or landslide, may not be for the entire area.
- Dilley, M., R.S. Chen, U. Deichmann, A.L. Lerner-Lam, M. Arnold, J. Agwe, P. Buys, O. Kjekstad, B. Lyon, and G. Yetman. 2005. Natural Disaster Hotspots: A Global Risk Analysis. Washington, D.C.: World Bank. https://doi.org/10.1596/0-8213-5930-4.
- Center for Hazards and Risk Research - CHRR - Columbia University, Center for International Earth Science Information Network - CIESIN - Columbia University. 2005. Global Earthquake Hazard Distribution - Peak Ground Acceleration. Palisades, NY: NASA Socioeconomic Data and Applications Center (SEDAC). https://doi.org/10.7927/H4BZ63ZS.
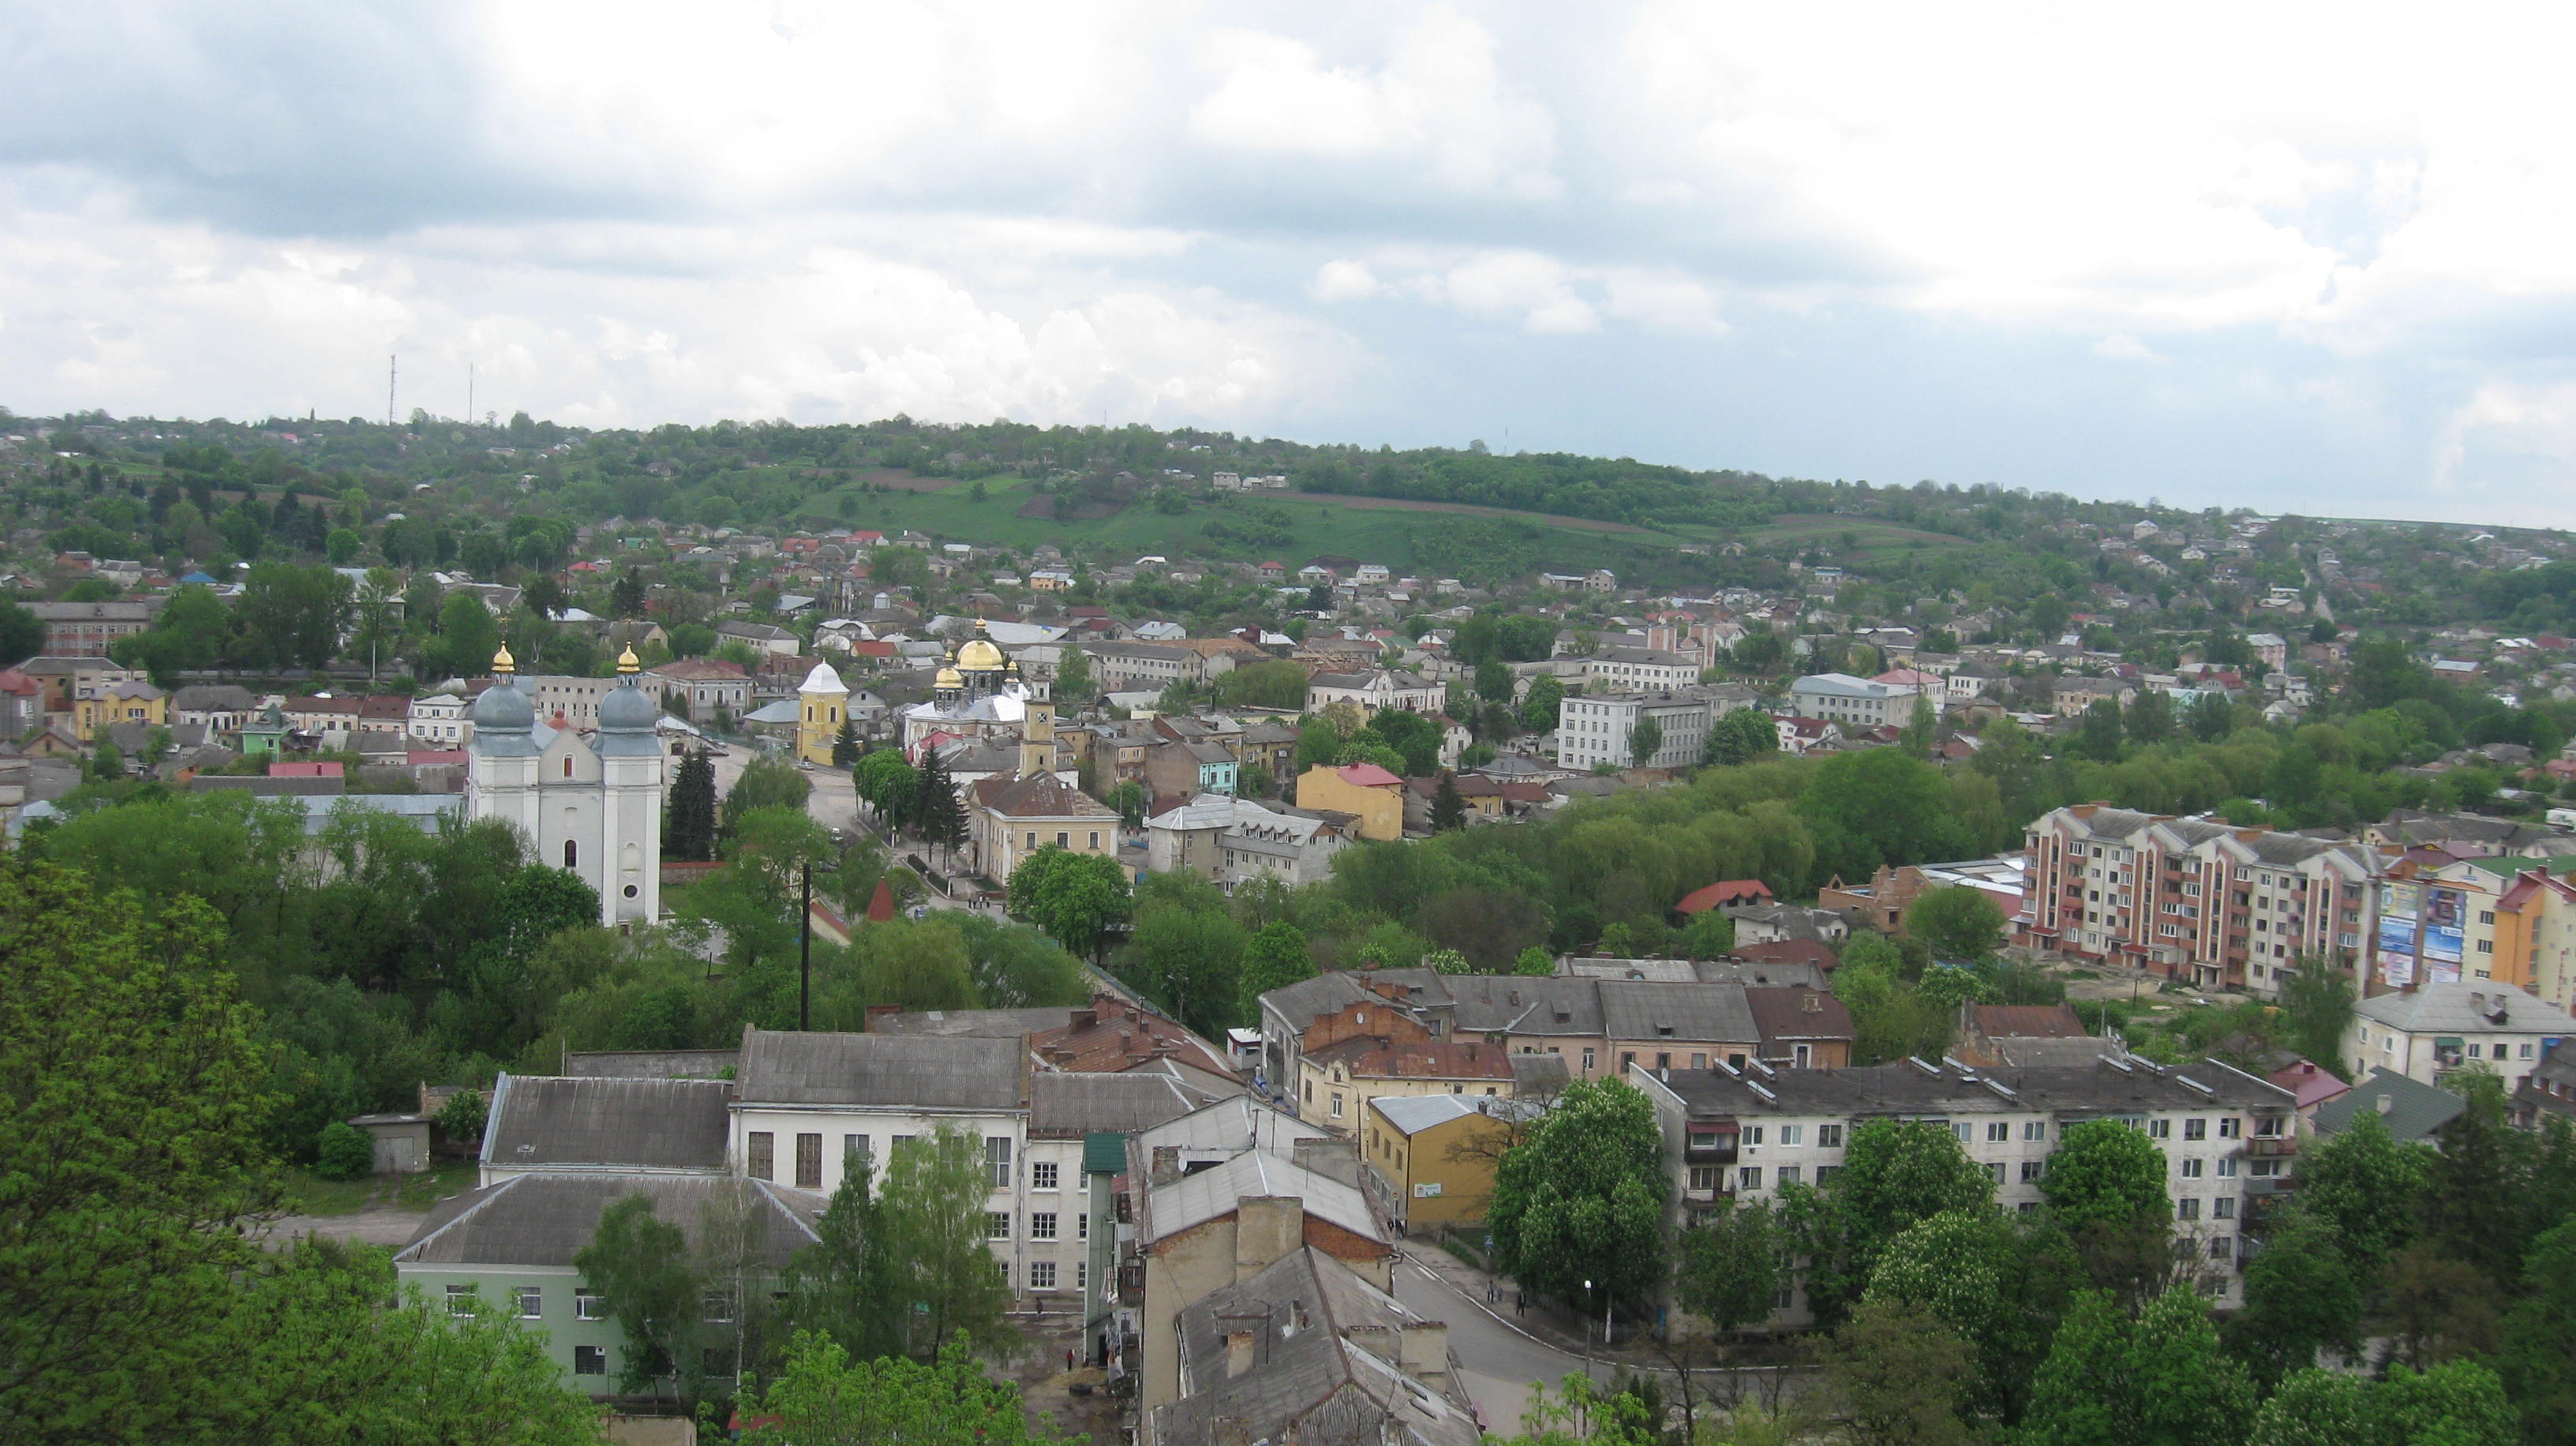
Ternopil
Ternopil (Ukrainian: Тернопіль, translit. Ternopil’, Polish & German: Tarnopol, Russian: Тернополь, translit. Ternopol’, Yiddish: טערנאָפּיל) is a city in western Ukraine, located on the banks of the Seret River. Until 1944 it was known mostly as Ta..
Ternopil Wikipedia Page

About Our Data
The data on this page is estimated using a number of publicly available tools and resources. It is provided without warranty, and could contain inaccuracies. Use at your own risk.