Industries
Business Distribution by Industry in Buwenge
| Industry Description | Number of Establishments |
|---|---|
| Education | 20 |
| Primary and elementary schools | 11 |
Buwenge Facts
| Area | 89.8 km² |
| Population | 89,599 |
| Male Population | 42,493 (47.4%) |
| Female Population | 47,106 (52.6%) |
| Population change (1975 to 2020) | +176.5% |
| Population change (2000 to 2020) | +58.2% |
| Median Age | 15.9 years (Male: 15, Female: 16.8) |
| Local Time | |
| Timezone | East Africa Time |
| Lat & Lng | 0.64222, 33.17444 |
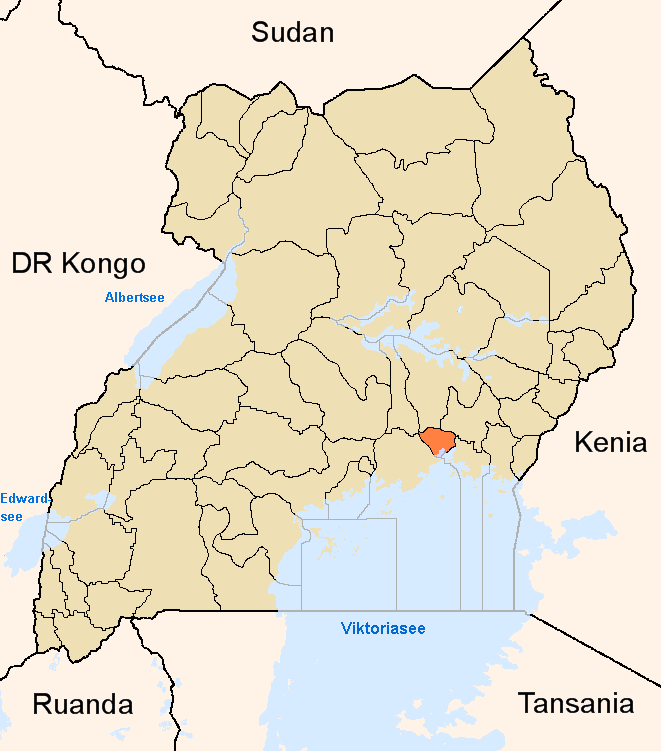
Map of Buwenge
Interactive Map
Buwenge Population
Years 1975 to 2020
| Data | 1975 | 1990 | 2000 | 2015 | 2020 |
|---|---|---|---|---|---|
| Population | 32,402 | 46,143 | 56,642 | 76,802 | 89,599 |
| Population Density | 361 / km² | 514.1 / km² | 631.1 / km² | 855.7 / km² | 998.3 / km² |
Buwenge Population change from 2000 to 2015
Increase of 35.6% from year 2000 to 2015
| Location | Change since 1975 | Change since 1990 | Change since 2000 |
|---|---|---|---|
| Buwenge | +137% | +66.4% | +35.6% |
| Uganda | +261.4% | +125% | +64.6% |
Buwenge Median Age
Median Age: 15.9 years
| Location | Median Age | Median Age (Female) | Median Age (Male) |
|---|---|---|---|
| Buwenge | 15.9 yrs | 16.8 yrs | 15 yrs |
| Uganda | 15.9 yrs | 16.8 yrs | 15 yrs |
Buwenge Population Density
Population Density: 998 / km²
| Location | Population | Area | Density |
|---|---|---|---|
| Buwenge | 89,599 | 89.8 km² | 998 / km² |
| Uganda | 39.1 million | 241,384.6 km² | 162 / km² |
Buwenge Historical and Projected Population
Estimated Population from 700 to 2100
- JRC (European Commission's Joint Research Centre) work on the GHS built-up grid
- CIESIN (Center for International Earth Science Information Network)
- [Link] Klein Goldewijk, K., Beusen, A., Doelman, J., and Stehfest, E.: Anthropogenic land use estimates for the Holocene – HYDE 3.2, Earth Syst. Sci. Data, 9, 927–953, https://doi.org/10.5194/essd-9-927-2017, 2017.
Human Development Index (HDI)
Statistic composite index of life expectancy, education, and per capita income.
Buwenge CO2 Emissions
Carbon Dioxide (CO2) Emissions Per Capita in Tonnes Per Year
| Location | CO2 Emissions | CO2 Emissions Per Capita | CO2 Emissions Intensity |
|---|---|---|---|
| Buwenge | 28,359 tn | 0.32 tn | 316 tons/km² |
| Uganda | 8,899,308 tn | 0.23 tn | 36.9 tons/km² |
| 2013 CO2 emissions (tonnes/year) | 28,359 tn |
| 2013 CO2 emissions (tonnes/year) per capita | 0.32 tn |
| 2013 CO2 emissions intensity (tonnes/km²/year) | 316 tons/km² |
Natural Hazards Risk
Relative risk out of 10
| Hazard | Risk Level |
|---|---|
| Flood | High (8) |
| Earthquake | Low (2) |
* Risk, particularly concerning flood or landslide, may not be for the entire area.
- Dilley, M., R.S. Chen, U. Deichmann, A.L. Lerner-Lam, M. Arnold, J. Agwe, P. Buys, O. Kjekstad, B. Lyon, and G. Yetman. 2005. Natural Disaster Hotspots: A Global Risk Analysis. Washington, D.C.: World Bank. https://doi.org/10.1596/0-8213-5930-4.
- Center for Hazards and Risk Research - CHRR - Columbia University, Center for International Earth Science Information Network - CIESIN - Columbia University. 2005. Global Flood Hazard Frequency and Distribution. Palisades, NY: NASA Socioeconomic Data and Applications Center (SEDAC). https://doi.org/10.7927/H4668B3D.
- Center for Hazards and Risk Research - CHRR - Columbia University, Center for International Earth Science Information Network - CIESIN - Columbia University. 2005. Global Earthquake Hazard Distribution - Peak Ground Acceleration. Palisades, NY: NASA Socioeconomic Data and Applications Center (SEDAC). https://doi.org/10.7927/H4BZ63ZS.
Recent Nearby Earthquakes
Magnitude 3.0 and greater
| Date▼ | Time↕ | Magnitude↕ | Distance↕ | Depth↕ | Location↕ | Link |
|---|---|---|---|---|---|---|
| 12/27/10 | 10:10 PM | 4.5 | 54.6 km | 10,000 m | Lake Victoria region, Uganda | usgs.gov |
| 8/11/90 | 2:34 AM | 4.5 | 53.1 km | 33,000 m | Lake Victoria region, Uganda | usgs.gov |
Buwenge
Buwenge is a town in Jinja District in Eastern Uganda. It was proposed as the headquarters of Jinja District in 2009 when local district leaders were lobbying government to grant Jinja city status.
Buwenge Wikipedia Page

About Our Data
The data on this page is estimated using a number of publicly available tools and resources. It is provided without warranty, and could contain inaccuracies. Use at your own risk.