Categories in Kasese
Industries
Business Distribution by Industry in Kasese
| Industry Description | Number of Establishments |
|---|---|
| Other membership organizations | 48 |
| Hotels and motels | 43 |
| Education | 38 |
| Religion | 38 |
| Primary and elementary schools | 35 |
| Other accommodation | 32 |
| Shopping | 22 |
| Corporate management | 20 |
| Gas station | 19 |
| Restaurants | 16 |
| Churches | 14 |
| Grocery stores and supermarkets | 13 |
| Travel agencies | 11 |
| Tour operators | 11 |
Kasese Facts
| Area | 126.0 km² |
| Population | 128,863 |
| Male Population | 61,248 (47.5%) |
| Female Population | 67,615 (52.5%) |
| Population change (1975 to 2020) | +257.6% |
| Population change (2000 to 2020) | +68.8% |
| Median Age | 15.9 years (Male: 15, Female: 16.8) |
| Area Codes | 483 |
| Neighborhoods | Nyakasanga Lower |
| Local Time | |
| Timezone | East Africa Time |
| Lat & Lng | 0.18333, 30.08333 |
Map of Kasese
Interactive Map
Kasese Population
Years 1975 to 2020
| Data | 1975 | 1990 | 2000 | 2015 | 2020 |
|---|---|---|---|---|---|
| Population | 36,039 | 57,581 | 76,337 | 113,919 | 128,863 |
| Population Density | 286 / km² | 457 / km² | 605.8 / km² | 904.1 / km² | 1,022.7 / km² |
Kasese Population change from 2000 to 2015
Increase of 49.2% from year 2000 to 2015
| Location | Change since 1975 | Change since 1990 | Change since 2000 |
|---|---|---|---|
| Kasese | +216.1% | +97.8% | +49.2% |
| Uganda | +261.4% | +125% | +64.6% |
Kasese Median Age
Median Age: 15.9 years
| Location | Median Age | Median Age (Female) | Median Age (Male) |
|---|---|---|---|
| Kasese | 15.9 yrs | 16.8 yrs | 15 yrs |
| Uganda | 15.9 yrs | 16.8 yrs | 15 yrs |
Kasese Population Density
Population Density: 1,023 / km²
| Location | Population | Area | Density |
|---|---|---|---|
| Kasese | 128,863 | 126 km² | 1,023 / km² |
| Uganda | 39.1 million | 241,384.6 km² | 162 / km² |
Kasese Historical and Projected Population
Estimated Population from 1400 to 2100
- JRC (European Commission's Joint Research Centre) work on the GHS built-up grid
- CIESIN (Center for International Earth Science Information Network)
- [Link] Klein Goldewijk, K., Beusen, A., Doelman, J., and Stehfest, E.: Anthropogenic land use estimates for the Holocene – HYDE 3.2, Earth Syst. Sci. Data, 9, 927–953, https://doi.org/10.5194/essd-9-927-2017, 2017.
Price Distribution
Business distribution by price for Kasese
Human Development Index (HDI)
Statistic composite index of life expectancy, education, and per capita income.
Kasese CO2 Emissions
Carbon Dioxide (CO2) Emissions Per Capita in Tonnes Per Year
| Location | CO2 Emissions | CO2 Emissions Per Capita | CO2 Emissions Intensity |
|---|---|---|---|
| Kasese | 33,806 tn | 0.26 tn | 268.3 tons/km² |
| Uganda | 8,899,308 tn | 0.23 tn | 36.9 tons/km² |
| 2013 CO2 emissions (tonnes/year) | 33,806 tn |
| 2013 CO2 emissions (tonnes/year) per capita | 0.26 tn |
| 2013 CO2 emissions intensity (tonnes/km²/year) | 268.3 tons/km² |
Natural Hazards Risk
Relative risk out of 10
| Hazard | Risk Level |
|---|---|
| Flood | High (9) |
| Earthquake | Medium (4) |
| Landslide | High (8) |
* Risk, particularly concerning flood or landslide, may not be for the entire area.
- Dilley, M., R.S. Chen, U. Deichmann, A.L. Lerner-Lam, M. Arnold, J. Agwe, P. Buys, O. Kjekstad, B. Lyon, and G. Yetman. 2005. Natural Disaster Hotspots: A Global Risk Analysis. Washington, D.C.: World Bank. https://doi.org/10.1596/0-8213-5930-4.
- Center for Hazards and Risk Research - CHRR - Columbia University, Center for International Earth Science Information Network - CIESIN - Columbia University, and Norwegian Geotechnical Institute - NGI. 2005. Global Landslide Hazard Distribution. Palisades, NY: NASA Socioeconomic Data and Applications Center (SEDAC). https://doi.org/10.7927/H4P848VZ.
- Center for Hazards and Risk Research - CHRR - Columbia University, Center for International Earth Science Information Network - CIESIN - Columbia University. 2005. Global Flood Hazard Frequency and Distribution. Palisades, NY: NASA Socioeconomic Data and Applications Center (SEDAC). https://doi.org/10.7927/H4668B3D.
- Center for Hazards and Risk Research - CHRR - Columbia University, Center for International Earth Science Information Network - CIESIN - Columbia University. 2005. Global Earthquake Hazard Distribution - Peak Ground Acceleration. Palisades, NY: NASA Socioeconomic Data and Applications Center (SEDAC). https://doi.org/10.7927/H4BZ63ZS.
Recent Nearby Earthquakes
Magnitude 3.0 and greater
| Date▼ | Time↕ | Magnitude↕ | Distance↕ | Depth↕ | Location↕ | Link |
|---|---|---|---|---|---|---|
| 8/6/19 | 4:58 PM | 4.6 | 16.8 km | 10,000 m | 16km SSE of Kasese, Uganda | usgs.gov |
| 2/12/19 | 5:38 PM | 3.9 | 45.9 km | 10,000 m | 39km SW of Kilembe, Uganda | usgs.gov |
| 12/1/18 | 6:36 PM | 4.3 | 72.3 km | 12,750 m | 27km SE of Butembo, Democratic Republic of the Congo | usgs.gov |
| 9/13/18 | 11:52 PM | 4.5 | 52 km | 10,000 m | 17km SW of Bundibugyo, Uganda | usgs.gov |
| 7/30/17 | 7:02 AM | 5.3 | 55.8 km | 10,000 m | 40km WNW of Rubirizi, Uganda | usgs.gov |
| 4/10/17 | 8:17 AM | 4.5 | 45.7 km | 15,080 m | 35km WNW of Rubirizi, Uganda | usgs.gov |
| 11/25/15 | 9:38 AM | 4.7 | 55.2 km | 10,000 m | 47km WNW of Rubirizi, Uganda | usgs.gov |
| 9/12/15 | 12:32 PM | 4.5 | 52.3 km | 18,360 m | 24km ESE of Beni, Democratic Republic of the Congo | usgs.gov |
| 2/13/15 | 8:35 AM | 4.4 | 66.6 km | 10,000 m | 48km W of Rubirizi, Uganda | usgs.gov |
| 11/20/14 | 11:56 PM | 4.4 | 77.8 km | 10,000 m | 51km SSE of Butembo, Democratic Republic of the Congo | usgs.gov |
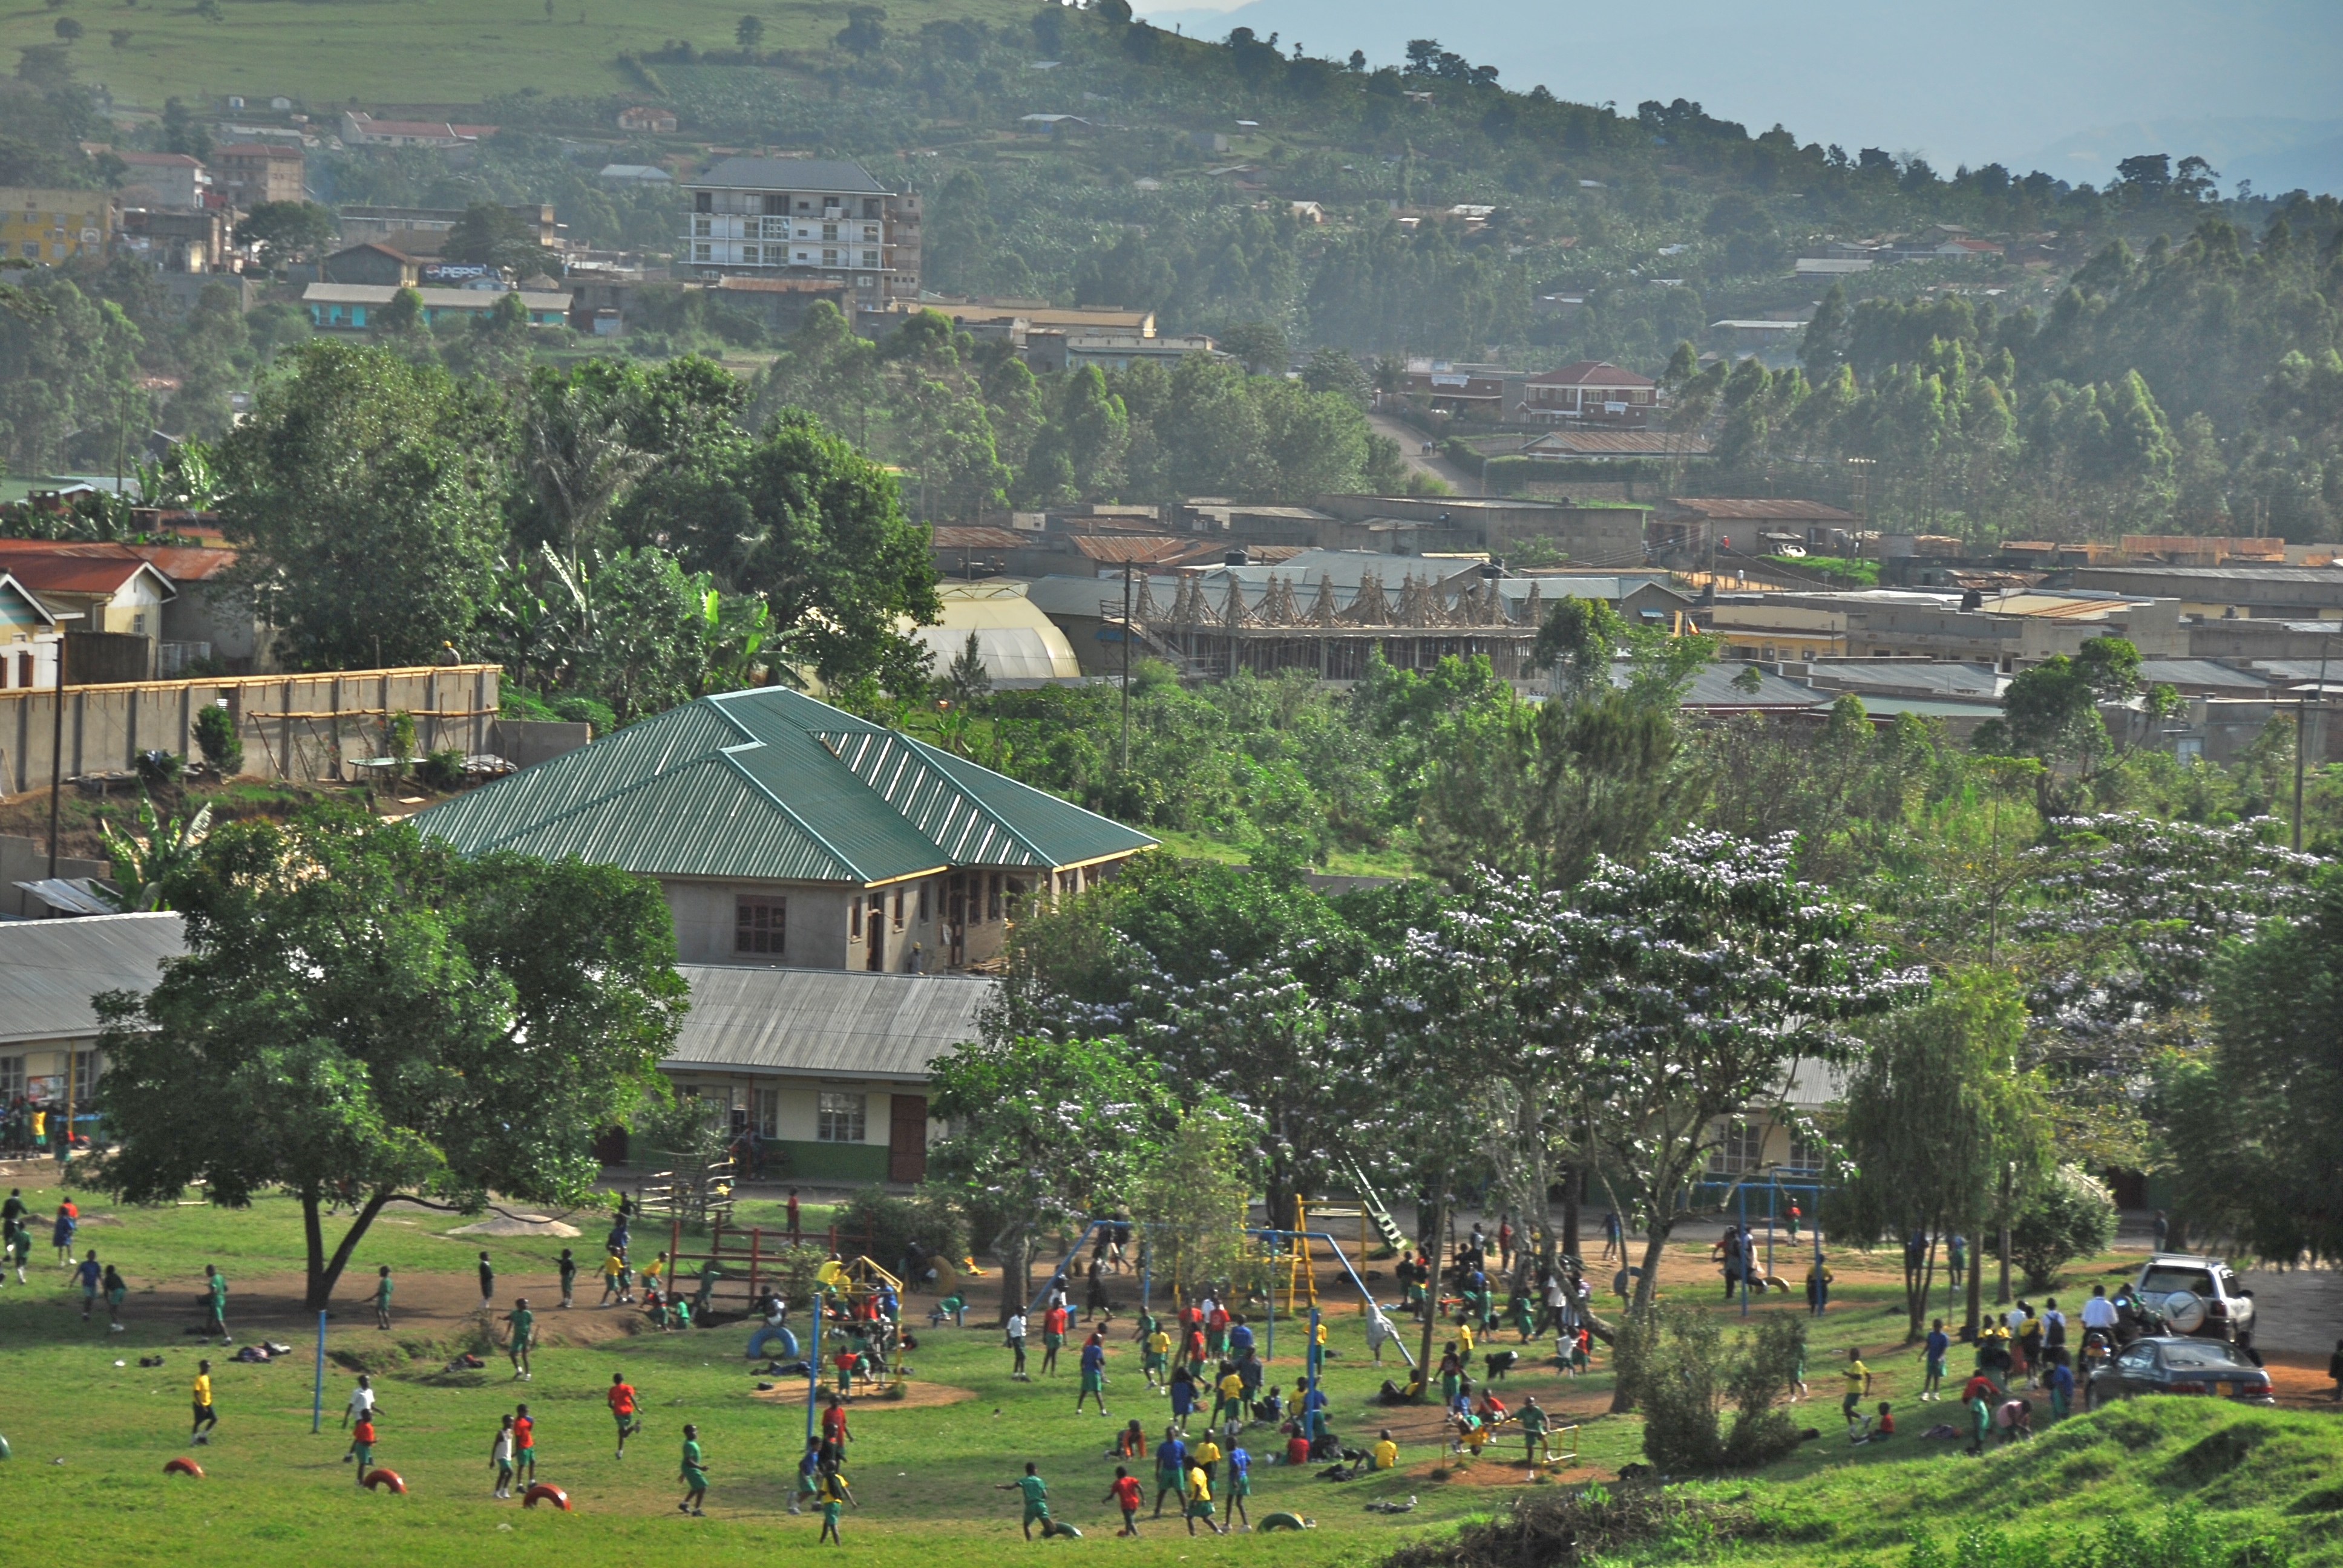
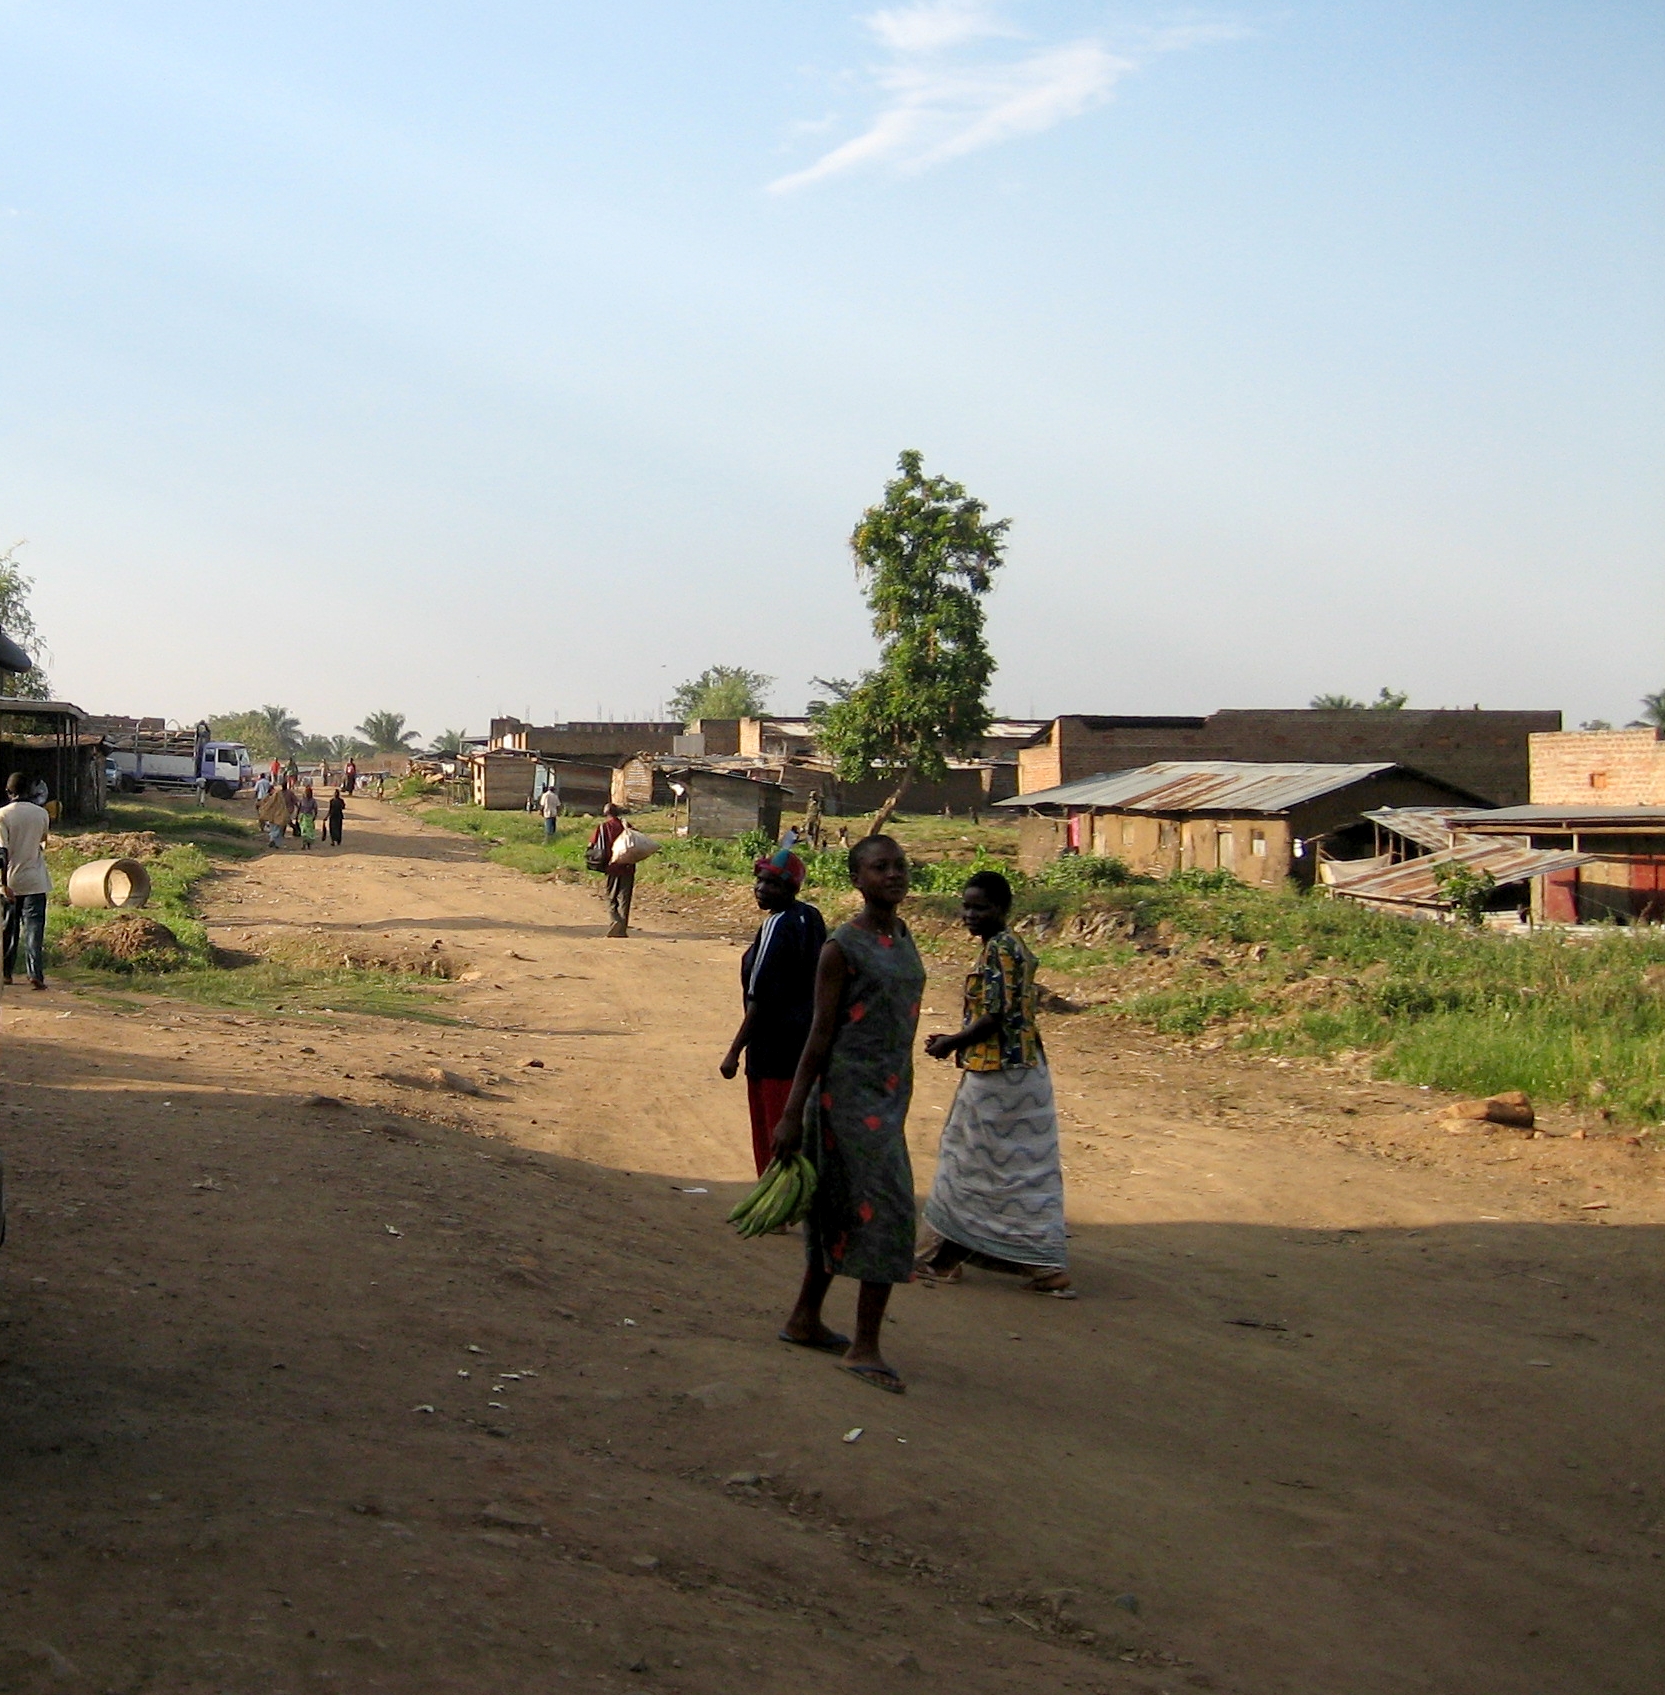
Kasese
Kasese is a town in the Western Region of Uganda, lying north of Lake George. It originally grew around the copper mine at Kilembe, while attention later turned to cobalt mining. It is the chief town of Kasese District, and the district headquarters ..
Kasese Wikipedia Page
About Our Data
The data on this page is estimated using a number of publicly available tools and resources. It is provided without warranty, and could contain inaccuracies. Use at your own risk.