Categories in Fort Carson
Industries
Business Distribution by Industry in Fort Carson
| Industry Description | Number of Establishments | Average Age of Business |
|---|---|---|
| Health and medical | 237 | — |
| Dentists | 85 | — |
| Military | 49 | — |
| Public administration | 46 | — |
| Physicians and surgeons | 46 | — |
| Restaurants | 42 | 26 years |
| Corporate management | 33 | — |
| Social work | 25 | — |
| Education | 19 | — |
| Shopping | 17 | — |
| Fitness centers | 16 | — |
| Pharmacies and drug stores | 15 | — |
| Nurses | 14 | — |
Fort Carson Facts
| Area | 8.8 mi² |
| Population | 15,539 |
| Male Population | 10,385 (66.8%) |
| Female Population | 5,154 (33.2%) |
| Population change (1975 to 2020) | +150.5% |
| Population change (2000 to 2020) | +35.0% |
| Median Age | 22.4 years (Male: 22.5, Female: 22.2) |
| Neighborhoods | Fountain Valley, Fort Carson, Southeast Colorado Springs, Colorado Springs, Norwood |
| Local Time | |
| Timezone | Mountain Daylight Time |
| Lat & Lng | 38.73749, -104.78886 |
Map of Fort Carson
Interactive Map
Fort Carson Population
Years 1975 to 2020
| Data | 1975 | 1990 | 2000 | 2015 | 2020 |
|---|---|---|---|---|---|
| Population | 6,203 | 9,279 | 11,512 | 14,944 | 15,539 |
| Population Density | 706.2 / mi² | 1,056.4 / mi² | 1,310.6 / mi² | 1,701.3 / mi² | 1,769 / mi² |
Fort Carson Population change from 2000 to 2015
Increase of 29.8% from year 2000 to 2015
| Location | Change since 1975 | Change since 1990 | Change since 2000 |
|---|---|---|---|
| Fort Carson | +140.9% | +61.1% | +29.8% |
| Colorado | +89.1% | +49.1% | +25.1% |
| United States | +46.9% | +27.2% | +13.7% |
Fort Carson Median Age
Median Age: 22.4 years
| Location | Median Age | Median Age (Female) | Median Age (Male) |
|---|---|---|---|
| Fort Carson | 22.4 yrs | 22.2 yrs | 22.5 yrs |
| Colorado | 36.1 yrs | 37.1 yrs | 35.2 yrs |
| United States | 37.4 yrs | 38.7 yrs | 36.1 yrs |
Fort Carson Population Density
Population Density: 1,769 / mi²
| Location | Population | Area | Density |
|---|---|---|---|
| Fort Carson | 15,539 | 8.78 sq mi | 1,769 / mi² |
| Colorado | 5.4 million | 104,093.9 sq mi | 52 / mi² |
| United States | 321.6 million | 3,796,740.8 sq mi | 84.7 / mi² |
Fort Carson Historical and Projected Population
Estimated Population from 1890 to 2100
- JRC (European Commission's Joint Research Centre) work on the GHS built-up grid
- CIESIN (Center for International Earth Science Information Network)
- [Link] Klein Goldewijk, K., Beusen, A., Doelman, J., and Stehfest, E.: Anthropogenic land use estimates for the Holocene – HYDE 3.2, Earth Syst. Sci. Data, 9, 927–953, https://doi.org/10.5194/essd-9-927-2017, 2017.
Neighborhoods in Fort Carson
Percentage of businesses by neighborhood in Fort Carson
Zip Codes
Percentage of businesses by Postal Codes in Fort Carson
Price Distribution
Business distribution by price for Fort Carson
Human Development Index (HDI)
Statistic composite index of life expectancy, education, and per capita income.
Fort Carson CO2 Emissions
Carbon Dioxide (CO2) Emissions Per Capita in Tonnes Per Year
| Location | CO2 Emissions | CO2 Emissions Per Capita | CO2 Emissions Intensity |
|---|---|---|---|
| Fort Carson | 191,837 tn | 12.35 tn | 21,839.8 tons/mi² |
| Colorado | 108,781,948 tn | 20.11 tn | 1,045 tons/mi² |
| United States | 5,664,619,810 tn | 17.62 tn | 1,492 tons/mi² |
| 2013 CO2 emissions (tonnes/year) | 191,837 tn |
| 2013 CO2 emissions (tonnes/year) per capita | 12.35 tn |
| 2013 CO2 emissions intensity (tonnes/mi²/year) | 21,839.8 tons/mi² |
Natural Hazards Risk
Relative risk out of 10
| Hazard | Risk Level |
|---|---|
| Drought | Medium (5) |
| Flood | Medium (4) |
* Risk, particularly concerning flood or landslide, may not be for the entire area.
- Dilley, M., R.S. Chen, U. Deichmann, A.L. Lerner-Lam, M. Arnold, J. Agwe, P. Buys, O. Kjekstad, B. Lyon, and G. Yetman. 2005. Natural Disaster Hotspots: A Global Risk Analysis. Washington, D.C.: World Bank. https://doi.org/10.1596/0-8213-5930-4.
- Center for Hazards and Risk Research - CHRR - Columbia University, Center for International Earth Science Information Network - CIESIN - Columbia University, and International Research Institute for Climate and Society - IRI - Columbia University. 2005. Global Drought Hazard Frequency and Distribution. Palisades, NY: NASA Socioeconomic Data and Applications Center (SEDAC). https://doi.org/10.7927/H4VX0DFT.
- Center for Hazards and Risk Research - CHRR - Columbia University, Center for International Earth Science Information Network - CIESIN - Columbia University. 2005. Global Flood Hazard Frequency and Distribution. Palisades, NY: NASA Socioeconomic Data and Applications Center (SEDAC). https://doi.org/10.7927/H4668B3D.
Recent Nearby Earthquakes
Magnitude 3.0 and greater
| Date▼ | Time↕ | Magnitude↕ | Distance↕ | Depth↕ | Location↕ | Link |
|---|---|---|---|---|---|---|
| 11/30/17 | 10:17 PM | 3.6 | 94 km | 5,000 m | 23km SE of Salida, Colorado | usgs.gov |
| 1/26/08 | 3:49 AM | 3.1 | 76 km | 5,000 m | Colorado | usgs.gov |
| 7/22/01 | 7:22 PM | 3.1 | 43.2 km | 5,000 m | Colorado | usgs.gov |
| 1/18/97 | 10:04 PM | 3.3 | 48.5 km | 5,000 m | Colorado | usgs.gov |
| 12/23/95 | 6:51 AM | 3.5 | 11.2 km | 5,000 m | Colorado | usgs.gov |
| 12/25/94 | 7:06 PM | 4 | 61.4 km | 10,000 m | Colorado | usgs.gov |
| 3/16/85 | 9:55 PM | 3.3 | 94.5 km | 5,000 m | Colorado | usgs.gov |
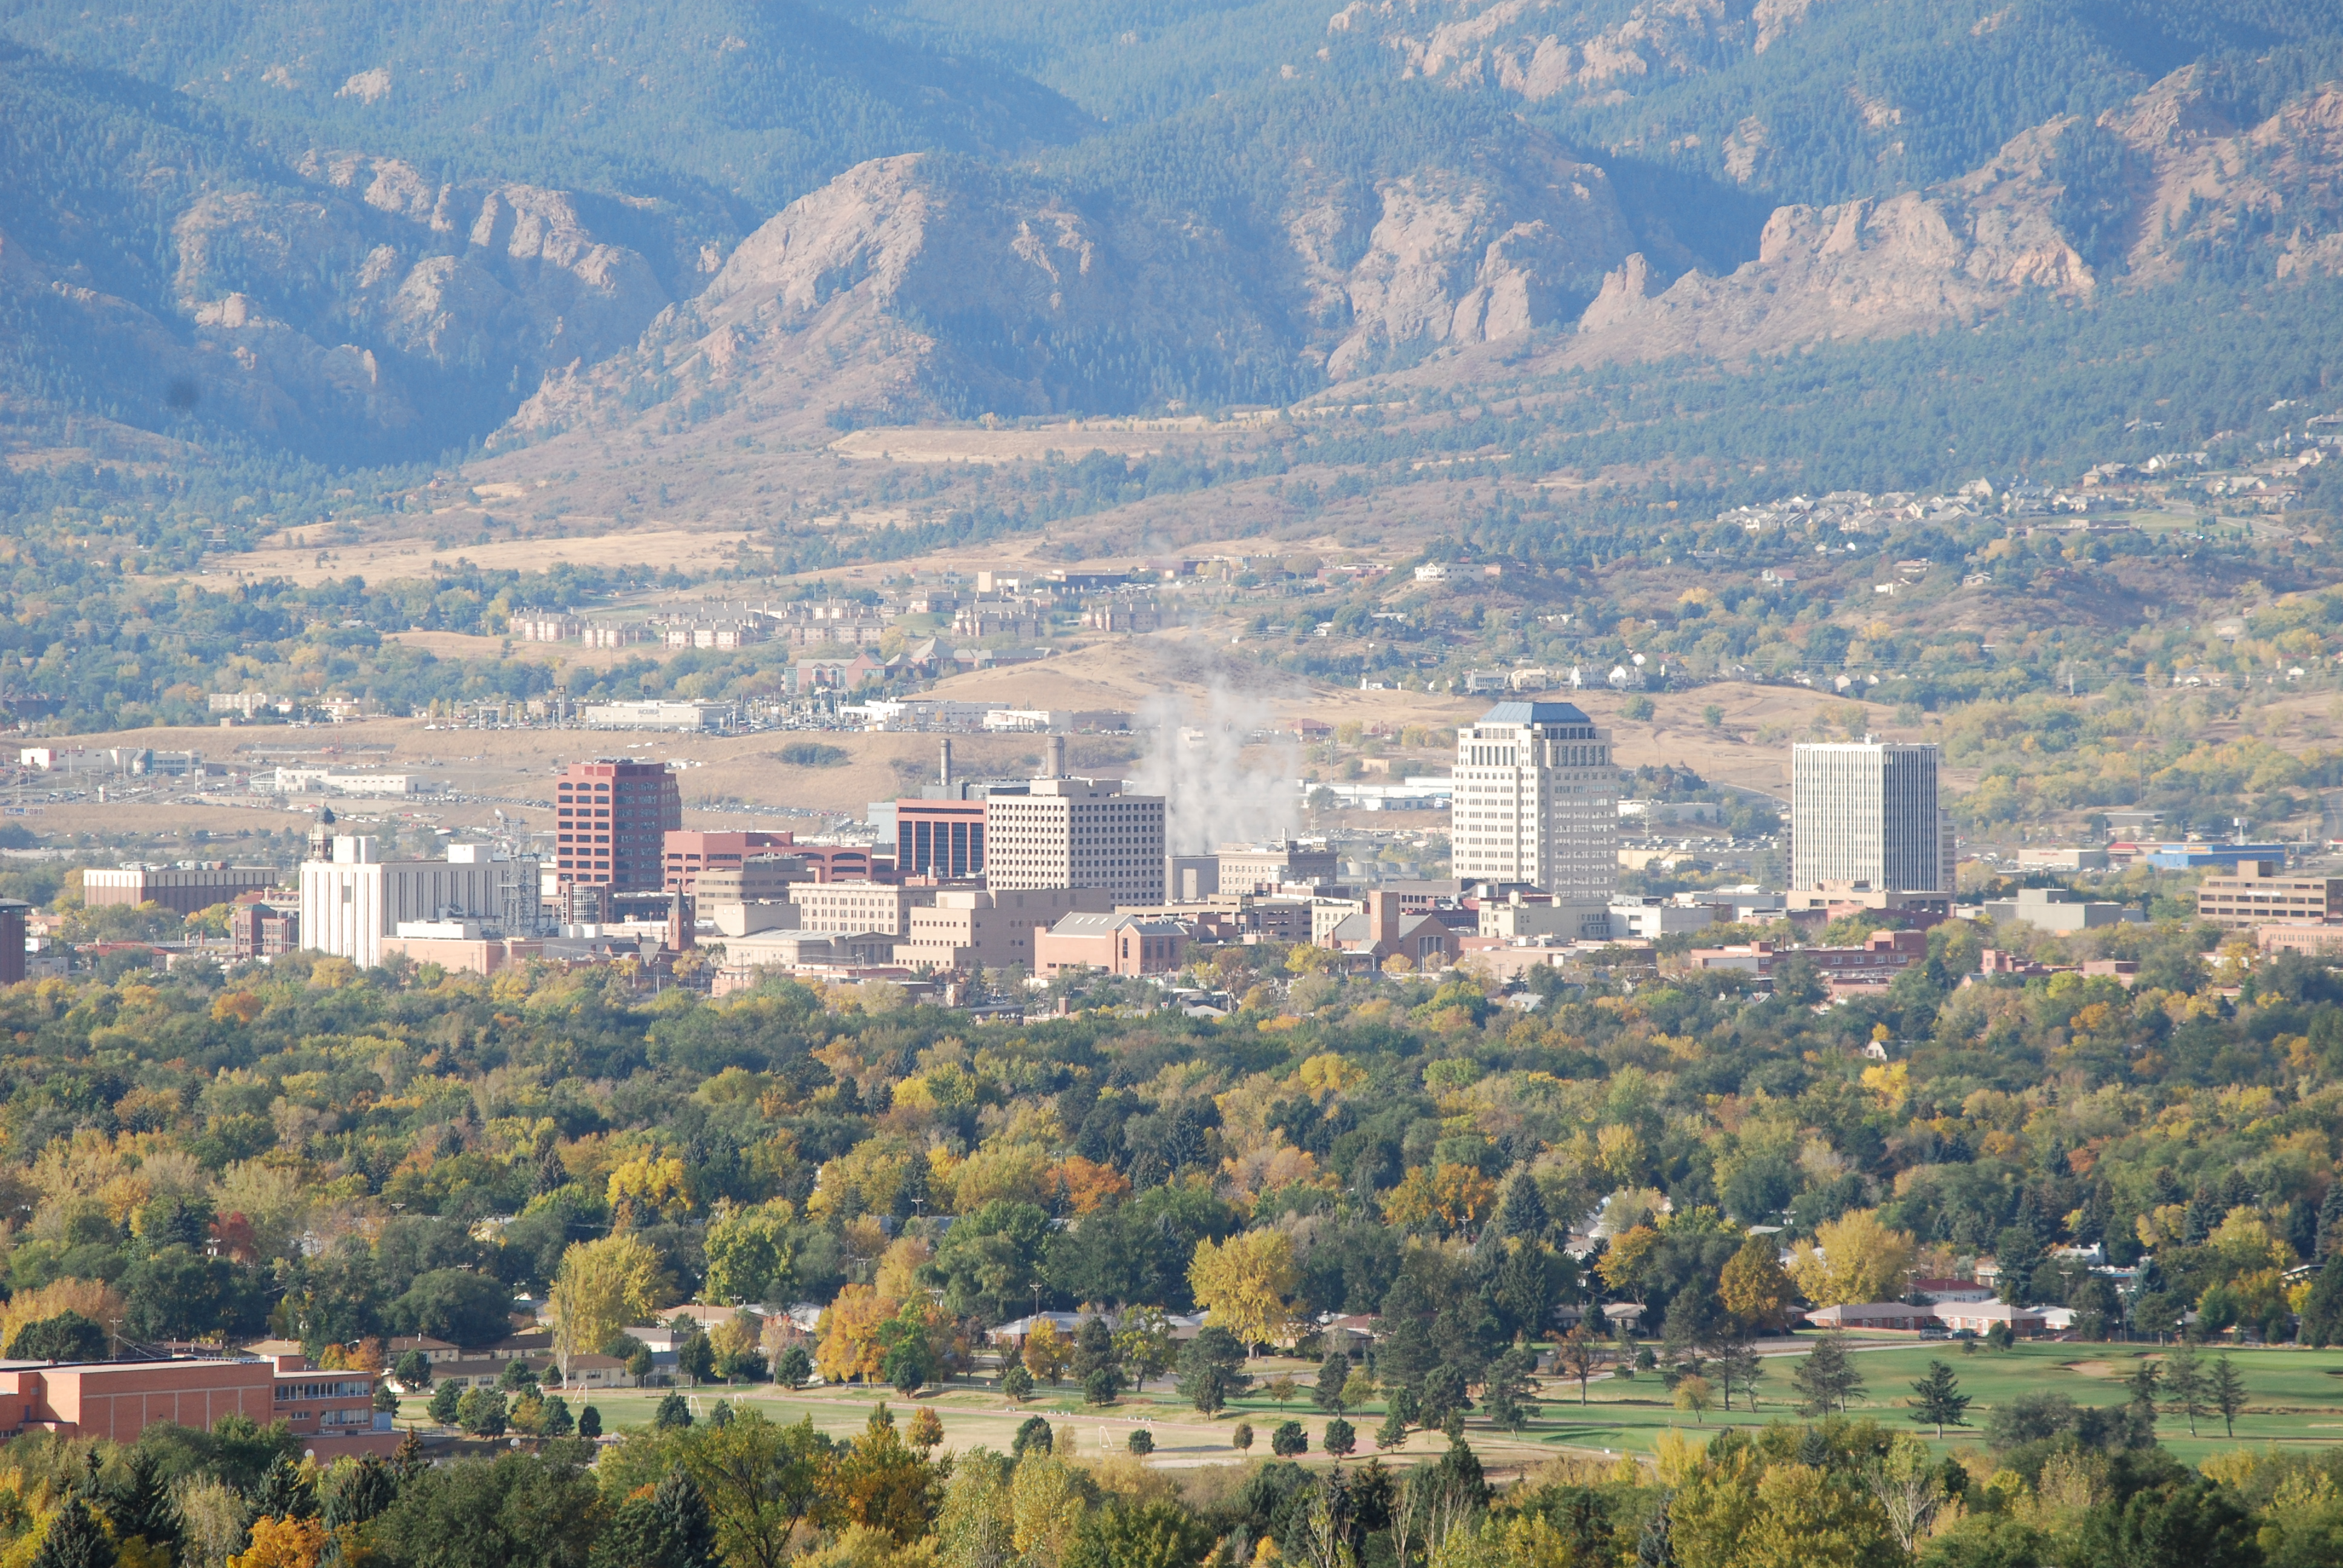
Fort Carson
Fort Carson is a United States Army installation located near Colorado Springs, primarily in El Paso County, Colorado. 137,000-acre (550 km2) installation extends southward into Pueblo and Fremont counties. That part of the installation located with..
Fort Carson Wikipedia Page

About Our Data
The data on this page is estimated using a number of publicly available tools and resources. It is provided without warranty, and could contain inaccuracies. Use at your own risk.