Map of Gray, Iowa
Interactive Map
Gray, Iowa Population
Years 1975 to 2020
| Data | 1975 | 1990 | 2000 | 2015 | 2020 |
|---|---|---|---|---|---|
| Population | 44 | 59 | 71 | 60 | 60 |
| Population Density | 46.8 / mi² | 62.7 / mi² | 75.4 / mi² | 63.8 / mi² | 63.8 / mi² |
Sources: JRC (European Commission's Joint Research Centre) work on the GHS built-up grid
Gray, Iowa Population change from 2000 to 2015
Decrease of 15.5% from year 2000 to 2015
| Location | Change since 1975 | Change since 1990 | Change since 2000 |
|---|---|---|---|
| Gray, Iowa | +36.4% | +1.7% | -15.5% |
| Iowa | +21% | +11.9% | +5% |
| United States | +46.9% | +27.2% | +13.7% |
Sources: JRC (European Commission's Joint Research Centre) work on the GHS built-up grid
Gray, Iowa Population Density
Population Density: 63.8 / mi²
| Location | Population | Area | Density |
|---|---|---|---|
| Gray, Iowa | 60 | 0.941 sq mi | 63.8 / mi² |
| Iowa | 3.1 million | 56,272.8 sq mi | 54.9 / mi² |
| United States | 321.6 million | 3,796,740.8 sq mi | 84.7 / mi² |
Sources: JRC (European Commission's Joint Research Centre) work on the GHS built-up grid
Gray, Iowa Historical and Projected Population
Estimated Population from 0 to 2100
Sources:
- JRC (European Commission's Joint Research Centre) work on the GHS built-up grid
- CIESIN (Center for International Earth Science Information Network)
- [Link] Klein Goldewijk, K., Beusen, A., Doelman, J., and Stehfest, E.: Anthropogenic land use estimates for the Holocene – HYDE 3.2, Earth Syst. Sci. Data, 9, 927–953, https://doi.org/10.5194/essd-9-927-2017, 2017.
Human Development Index (HDI)
Statistic composite index of life expectancy, education, and per capita income.
Source: [Link] Kummu, M., Taka, M. &Guillaume, J. Gridded global datasets for Gross Domestic Product and Human Development Index over 1990–2015. Sci Data 5, 180004 (2018) doi:10.1038/sdata.2018.4
Gray, Iowa CO2 Emissions
Carbon Dioxide (CO2) Emissions Per Capita in Tonnes Per Year
| Location | CO2 Emissions | CO2 Emissions Per Capita | CO2 Emissions Intensity |
|---|---|---|---|
| Gray, Iowa | 1,150 tn | 19.17 tn | 1,222.3 tons/mi² |
| Iowa | 60,512,078 tn | 19.6 tn | 1,075.3 tons/mi² |
| United States | 5,664,619,810 tn | 17.62 tn | 1,492 tons/mi² |
Sources: [Link] Moran, D., Kanemoto K; Jiborn, M., Wood, R., Többen, J., and Seto, K.C. (2018) Carbon footprints of 13,000 cities. Environmental Research Letters DOI: 10.1088/1748-9326/aac72a
Gray, Iowa CO2 Emissions
| 2013 CO2 emissions (tonnes/year) | 1,150 tn |
| 2013 CO2 emissions (tonnes/year) per capita | 19.17 tn |
| 2013 CO2 emissions intensity (tonnes/mi²/year) | 1,222.3 tons/mi² |
Natural Hazards Risk
Relative risk out of 10
| Hazard | Risk Level |
|---|---|
| Drought | Low (2) |
| Flood | High (8) |
* Risk, particularly concerning flood or landslide, may not be for the entire area.
Sources:
- Dilley, M., R.S. Chen, U. Deichmann, A.L. Lerner-Lam, M. Arnold, J. Agwe, P. Buys, O. Kjekstad, B. Lyon, and G. Yetman. 2005. Natural Disaster Hotspots: A Global Risk Analysis. Washington, D.C.: World Bank. https://doi.org/10.1596/0-8213-5930-4.
- Center for Hazards and Risk Research - CHRR - Columbia University, Center for International Earth Science Information Network - CIESIN - Columbia University, and International Research Institute for Climate and Society - IRI - Columbia University. 2005. Global Drought Hazard Frequency and Distribution. Palisades, NY: NASA Socioeconomic Data and Applications Center (SEDAC). https://doi.org/10.7927/H4VX0DFT.
- Center for Hazards and Risk Research - CHRR - Columbia University, Center for International Earth Science Information Network - CIESIN - Columbia University. 2005. Global Flood Hazard Frequency and Distribution. Palisades, NY: NASA Socioeconomic Data and Applications Center (SEDAC). https://doi.org/10.7927/H4668B3D.
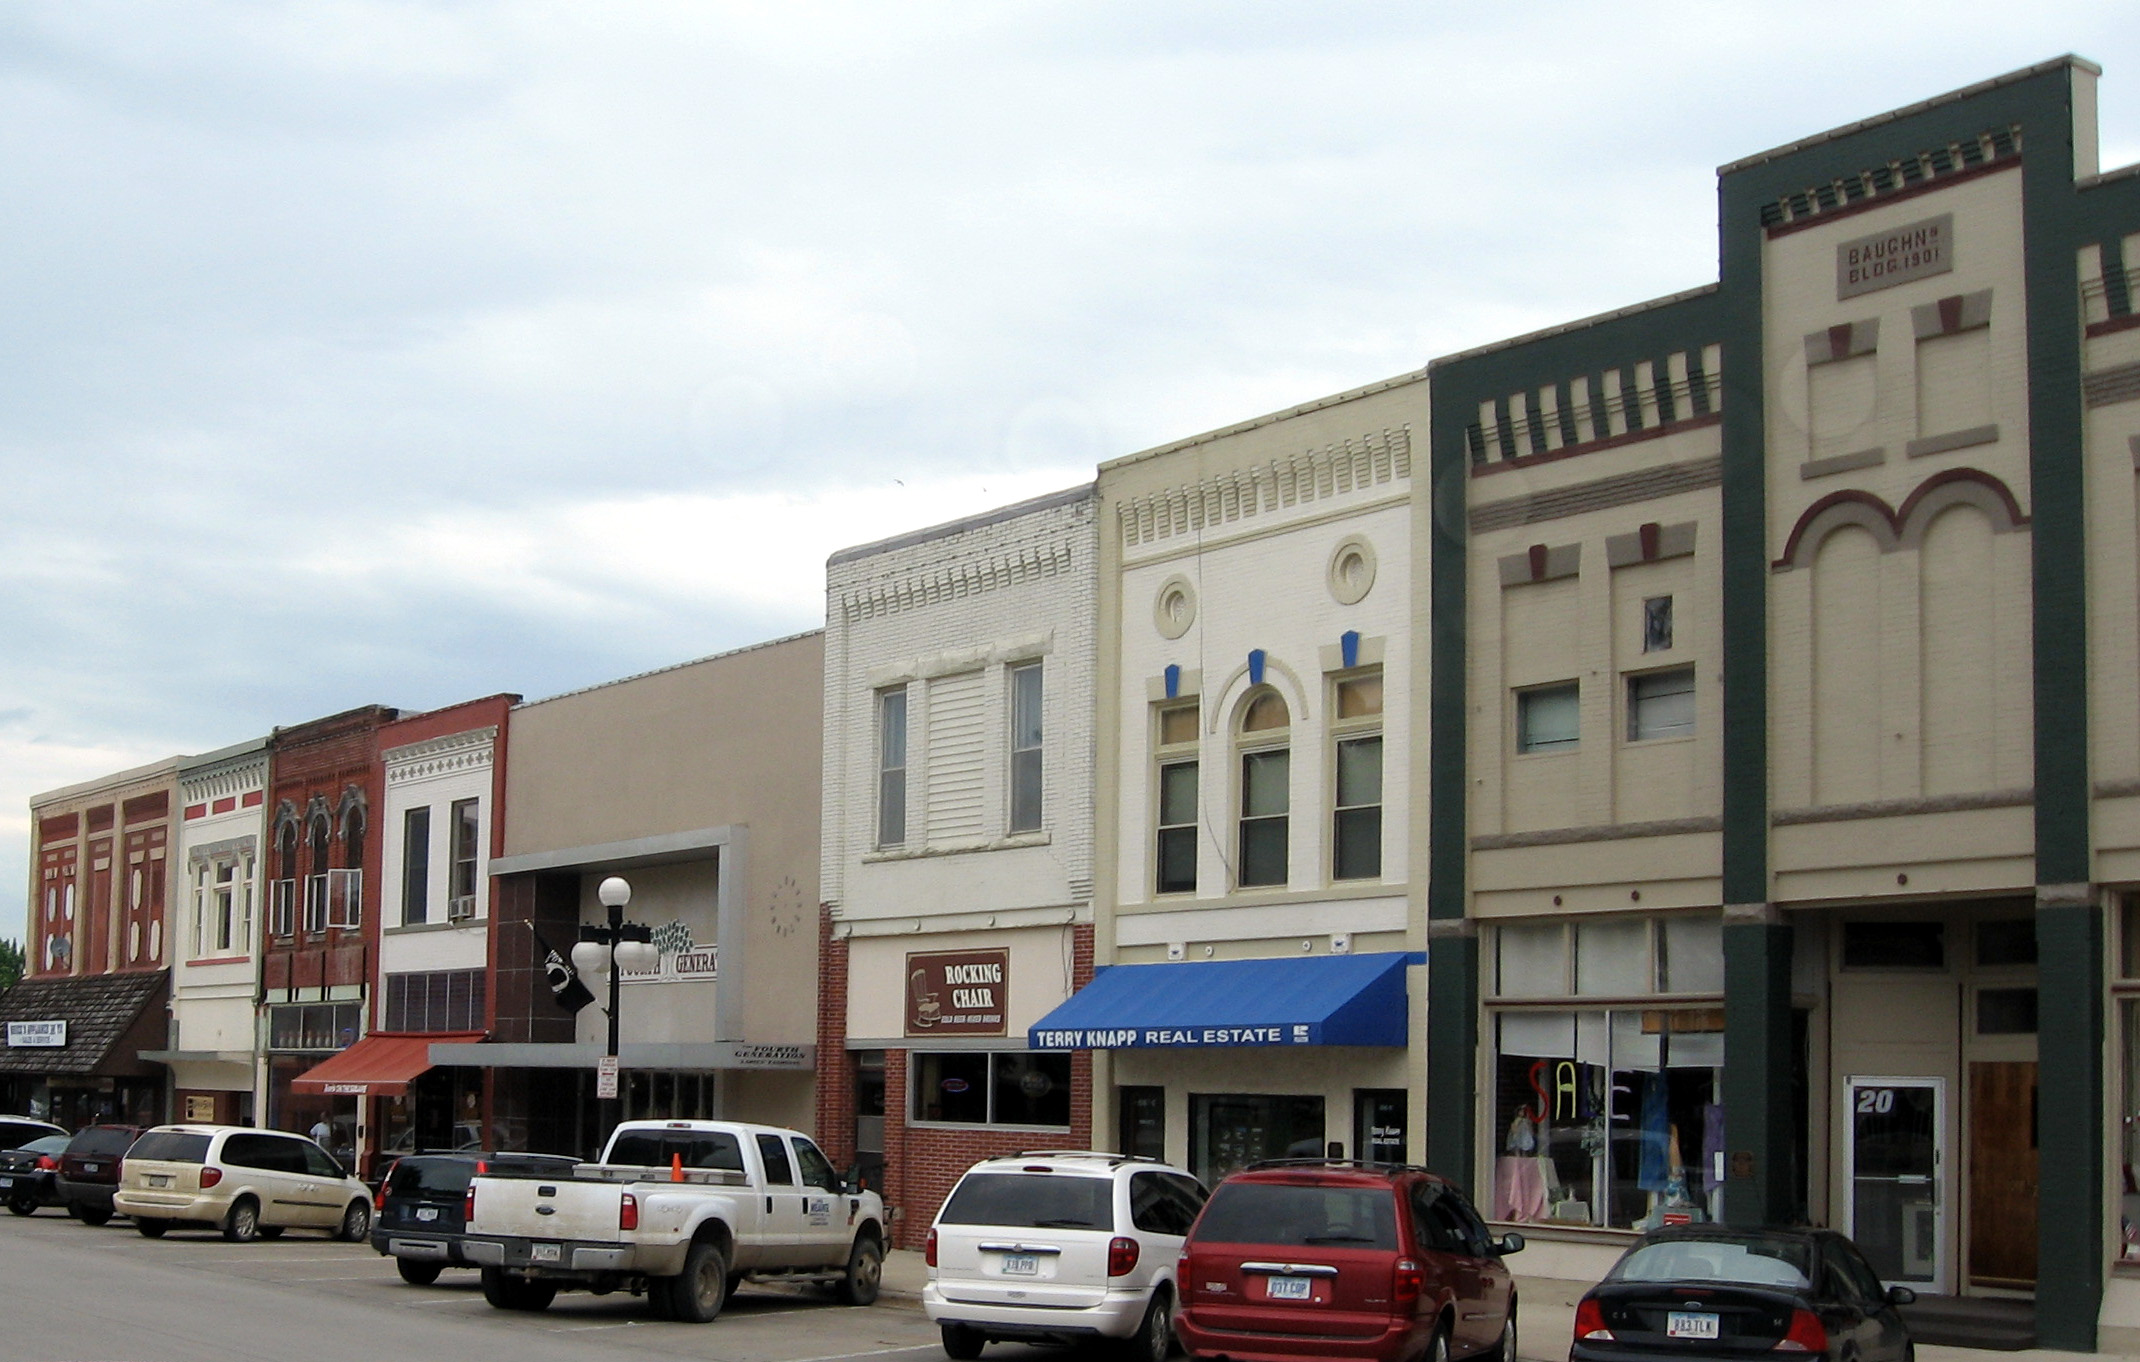
Gray, Iowa
Gray is a city in Audubon County, Iowa, United States, along the East Branch of the West Nishnabotna River. The population was 63 at the 2010 census.
Gray, Iowa Wikipedia Page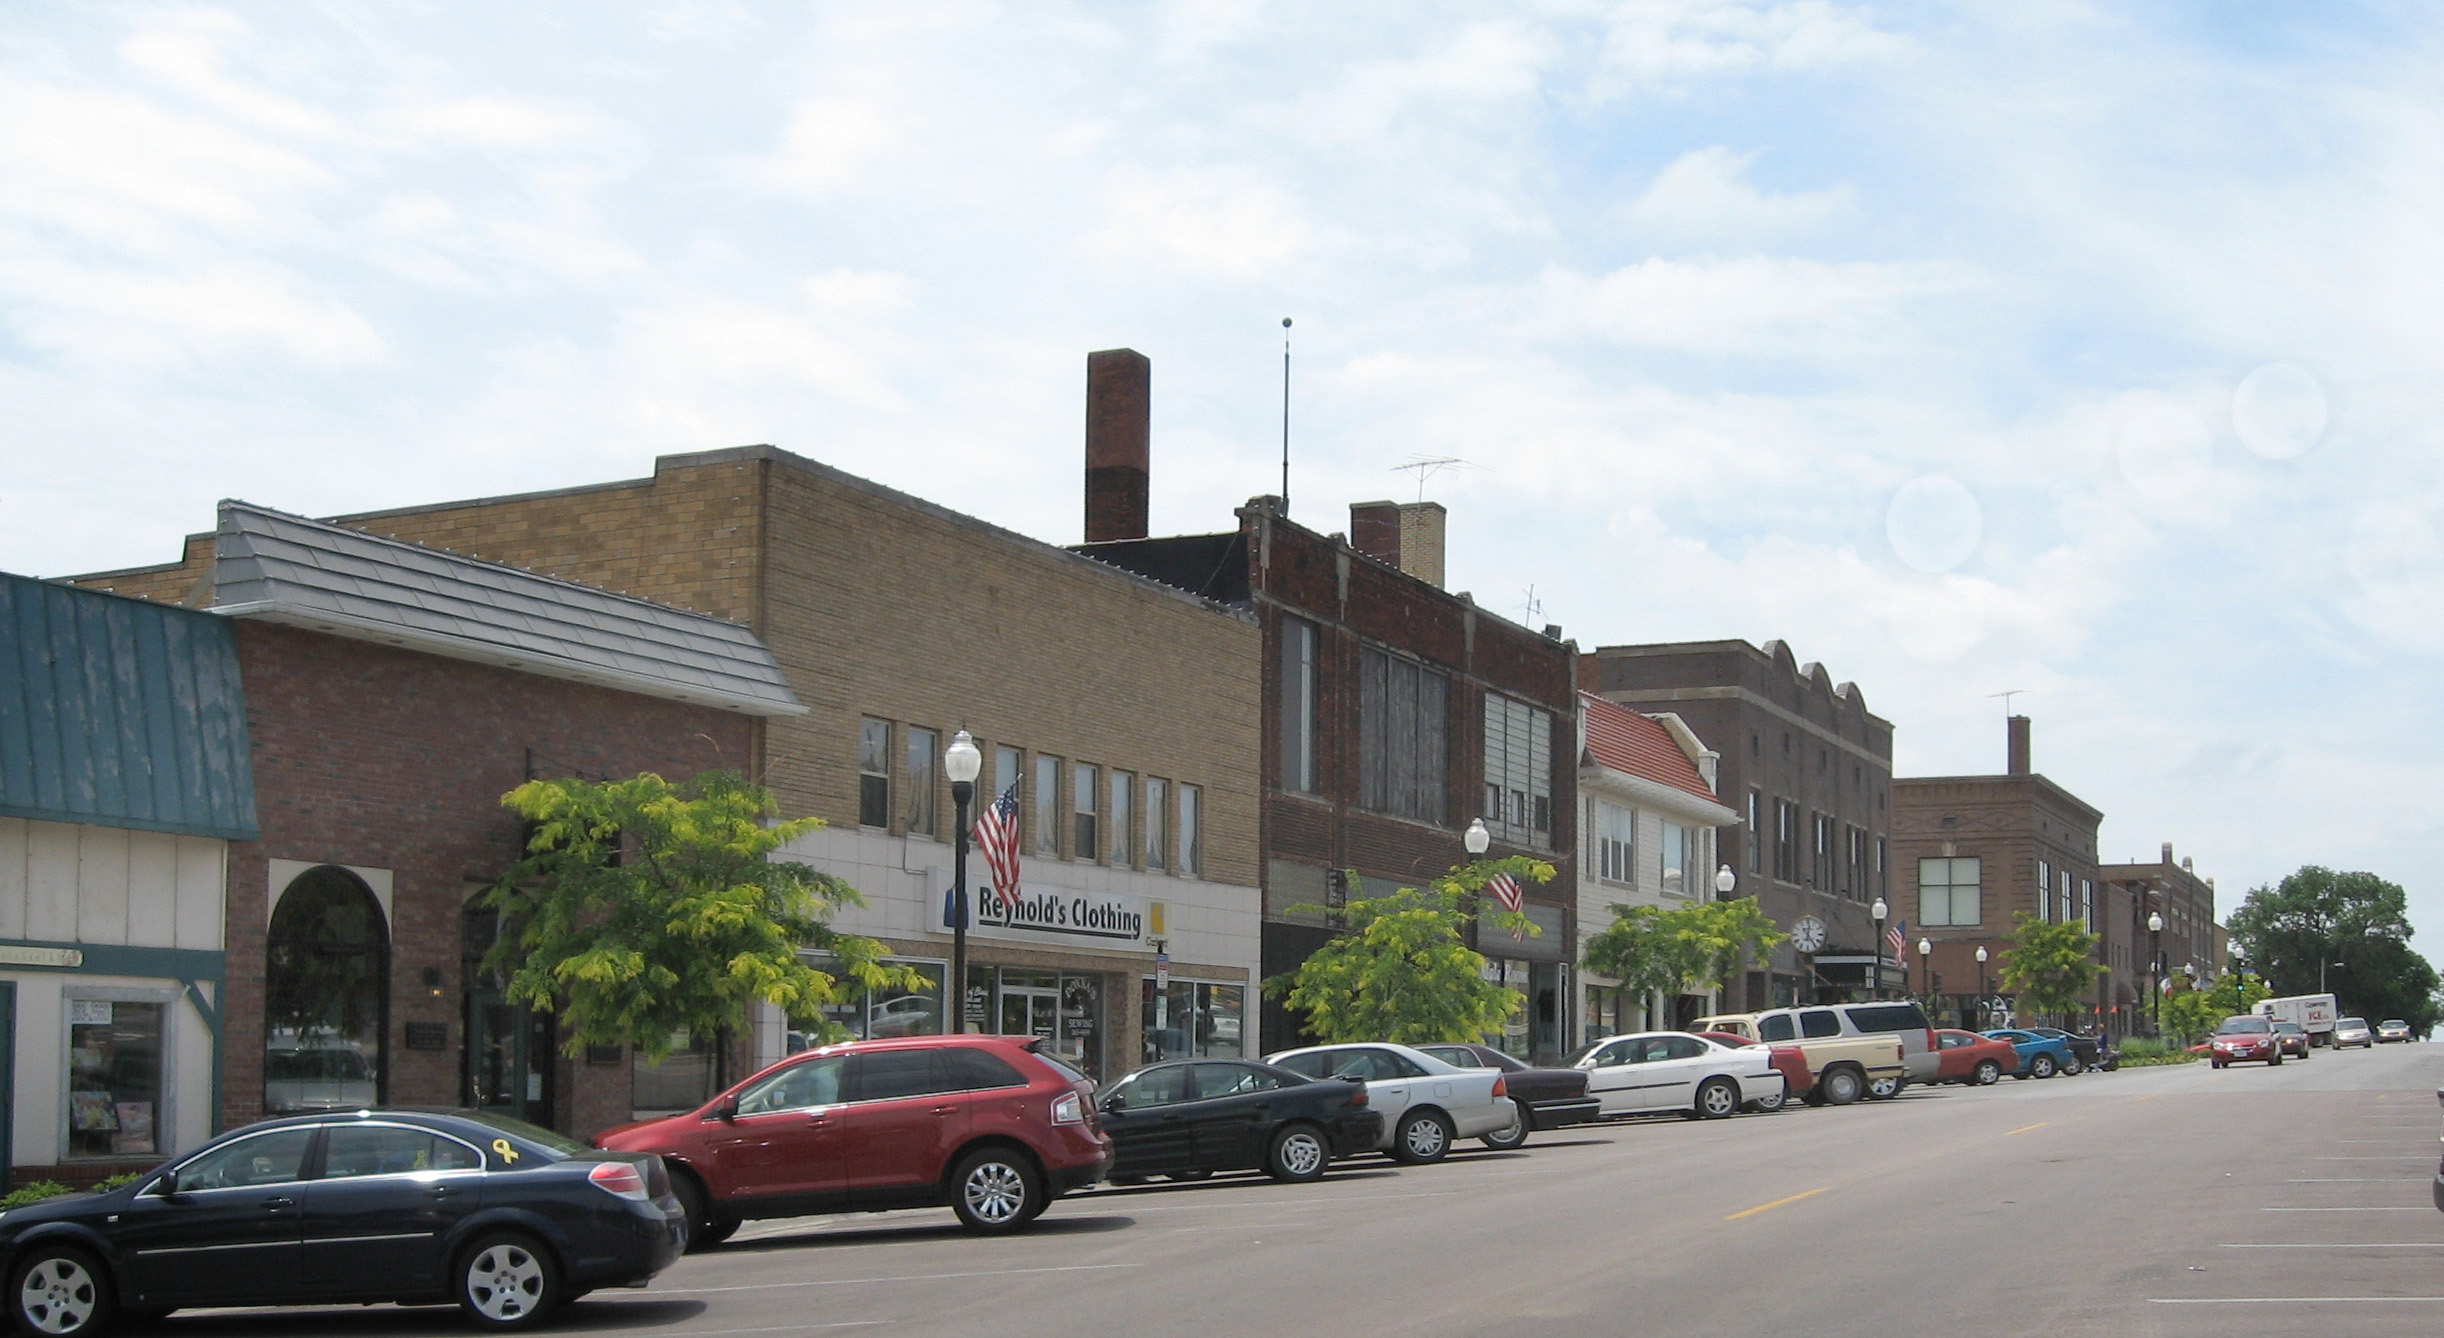

About Our Data
The data on this page is estimated using a number of publicly available tools and resources. It is provided without warranty, and could contain inaccuracies. Use at your own risk.