Categories in Honolulu
Industries
Business Distribution by Industry in Honolulu
| Industry Description | Number of Establishments | Average Age of Business |
|---|---|---|
| Health and medical | 8,013 | 29 years |
| Restaurants | 4,718 | 26 years |
| Lawyers legal | 4,157 | 31 years |
| Real estate | 3,987 | 31 years |
| Corporate management | 2,398 | 27 years |
| Shopping | 2,245 | 32 years |
| Physicians and surgeons | 2,228 | 31 years |
| Construction of buildings | 1,358 | 32 years |
| Clothing stores | 1,324 | 30 years |
| Dentists | 1,247 | 33 years |
| Finance other | 1,097 | 46 years |
| Shopping other | 1,087 | 33 years |
| Buses and trains | 1,086 | 26 years |
| Hairdressers | 1,075 | 25 years |
| Travel agencies | 1,044 | 29 years |
| Public administration | 1,031 | 39 years |
Honolulu Facts
| Area | 62.0 mi² |
| Population | 363,363 |
| Male Population | 179,716 (49.5%) |
| Female Population | 183,647 (50.5%) |
| Population change (1975 to 2020) | +93.0% |
| Population change (2000 to 2020) | +16.5% |
| Median Age | 41.7 years (Male: 40.3, Female: 43.2) |
| Area Codes | 808 |
| Neighborhoods | Downtown, Kalihi - Palama, Ala Moana, Waikīkī, Makiki - Lower Punchbowl - Tantalus |
| Local Time | |
| Timezone | Hawaii-Aleutian Standard Time |
| Lat & Lng | 21.30694, -157.85833 |
| Zip Codes | 96801, 96802, 96803, 96804, 96805, More |
Map of Honolulu
Interactive Map
Honolulu Population
Years 1975 to 2020
| Data | 1975 | 1990 | 2000 | 2015 | 2020 |
|---|---|---|---|---|---|
| Population | 188,285 | 257,069 | 311,933 | 348,568 | 363,363 |
| Population Density | 3,036 / mi² | 4,145.1 / mi² | 5,029.7 / mi² | 5,620.5 / mi² | 5,859 / mi² |
Honolulu Population change from 2000 to 2015
Increase of 11.7% from year 2000 to 2015
| Location | Change since 1975 | Change since 1990 | Change since 2000 |
|---|---|---|---|
| Honolulu | +85.1% | +35.6% | +11.7% |
| Hawaii | +67.2% | +35.6% | +17.3% |
| United States | +46.9% | +27.2% | +13.7% |
Honolulu Median Age
Median Age: 41.7 years
| Location | Median Age | Median Age (Female) | Median Age (Male) |
|---|---|---|---|
| Honolulu | 41.7 yrs | 43.2 yrs | 40.3 yrs |
| Hawaii | 38.7 yrs | 40 yrs | 37.4 yrs |
| United States | 37.4 yrs | 38.7 yrs | 36.1 yrs |
Honolulu Population Density
Population Density: 5,859 / mi²
| Location | Population | Area | Density |
|---|---|---|---|
| Honolulu | 363,363 | 62.02 sq mi | 5,859 / mi² |
| Hawaii | 1.4 million | 10,931.7 sq mi | 131 / mi² |
| United States | 321.6 million | 3,796,740.8 sq mi | 84.7 / mi² |
Honolulu Historical and Projected Population
Estimated Population from 1790 to 2100
- JRC (European Commission's Joint Research Centre) work on the GHS built-up grid
- CIESIN (Center for International Earth Science Information Network)
- [Link] Klein Goldewijk, K., Beusen, A., Doelman, J., and Stehfest, E.: Anthropogenic land use estimates for the Holocene – HYDE 3.2, Earth Syst. Sci. Data, 9, 927–953, https://doi.org/10.5194/essd-9-927-2017, 2017.
Neighborhoods in Honolulu
Percentage of businesses by neighborhood in Honolulu
Zip Codes
Percentage of businesses by Postal Codes in Honolulu
Price Distribution
Business distribution by price for Honolulu
Human Development Index (HDI)
Statistic composite index of life expectancy, education, and per capita income.
Honolulu CO2 Emissions
Carbon Dioxide (CO2) Emissions Per Capita in Tonnes Per Year
| Location | CO2 Emissions | CO2 Emissions Per Capita | CO2 Emissions Intensity |
|---|---|---|---|
| Honolulu | 4,456,951 tn | 12.27 tn | 71,865.9 tons/mi² |
| Hawaii | 14,215,500 tn | 9.95 tn | 1,300.4 tons/mi² |
| United States | 5,664,619,810 tn | 17.62 tn | 1,492 tons/mi² |
| 2013 CO2 emissions (tonnes/year) | 4,456,951 tn |
| 2013 CO2 emissions (tonnes/year) per capita | 12.27 tn |
| 2013 CO2 emissions intensity (tonnes/mi²/year) | 71,865.9 tons/mi² |
Natural Hazards Risk
Relative risk out of 10
| Hazard | Risk Level |
|---|---|
| Drought | Medium (5) |
| Flood | Medium (7) |
| Earthquake | Medium (3.8) |
* Risk, particularly concerning flood or landslide, may not be for the entire area.
- Dilley, M., R.S. Chen, U. Deichmann, A.L. Lerner-Lam, M. Arnold, J. Agwe, P. Buys, O. Kjekstad, B. Lyon, and G. Yetman. 2005. Natural Disaster Hotspots: A Global Risk Analysis. Washington, D.C.: World Bank. https://doi.org/10.1596/0-8213-5930-4.
- Center for Hazards and Risk Research - CHRR - Columbia University, Center for International Earth Science Information Network - CIESIN - Columbia University, and International Research Institute for Climate and Society - IRI - Columbia University. 2005. Global Drought Hazard Frequency and Distribution. Palisades, NY: NASA Socioeconomic Data and Applications Center (SEDAC). https://doi.org/10.7927/H4VX0DFT.
- Center for Hazards and Risk Research - CHRR - Columbia University, Center for International Earth Science Information Network - CIESIN - Columbia University. 2005. Global Flood Hazard Frequency and Distribution. Palisades, NY: NASA Socioeconomic Data and Applications Center (SEDAC). https://doi.org/10.7927/H4668B3D.
- Center for Hazards and Risk Research - CHRR - Columbia University, Center for International Earth Science Information Network - CIESIN - Columbia University. 2005. Global Earthquake Hazard Distribution - Peak Ground Acceleration. Palisades, NY: NASA Socioeconomic Data and Applications Center (SEDAC). https://doi.org/10.7927/H4BZ63ZS.
Recent Nearby Earthquakes
Magnitude 3.0 and greater
| Date▼ | Time↕ | Magnitude↕ | Distance↕ | Depth↕ | Location↕ | Link |
|---|---|---|---|---|---|---|
| 7/12/19 | 5:21 PM | 3.42 | 76.4 km | 13,020 m | 57km N of Kualapu'u, Hawaii | usgs.gov |
| 2/3/19 | 1:09 PM | 3.27 | 92.8 km | 29,620 m | 51km N of Kualapu'u, Hawaii | usgs.gov |
| 6/4/18 | 9:29 AM | 3.55 | 21.9 km | 31,560 m | 19km S of Waimanalo Beach, Hawaii | usgs.gov |
| 9/16/17 | 6:40 AM | 3.66 | 53.4 km | 10,046 m | 34km NE of Kaneohe Station, Hawaii | usgs.gov |
| 4/5/16 | 12:19 PM | 3.2 | 32.7 km | 13,530 m | 19km SE of Waimanalo Beach, Hawaii | usgs.gov |
| 8/22/14 | 12:37 PM | 4.2 | 75.8 km | 16,750 m | 74km WSW of Lana'i City, Hawaii | usgs.gov |
| 6/7/14 | 2:42 AM | 4.1 | 74.6 km | 7,440 m | 34km SW of Kaunakakai, Hawaii | usgs.gov |
| 5/29/14 | 2:40 AM | 3.8 | 83.4 km | 30,100 m | 56km N of Kualapu'u, Hawaii | usgs.gov |
| 7/29/13 | 8:30 PM | 3.7 | 26.5 km | 32,900 m | 12km SE of Waimanalo Beach, Hawaii | usgs.gov |
| 6/21/13 | 10:04 AM | 4.5 | 82.7 km | 11,900 m | 48km N of Kualapu'u, Hawaii | usgs.gov |
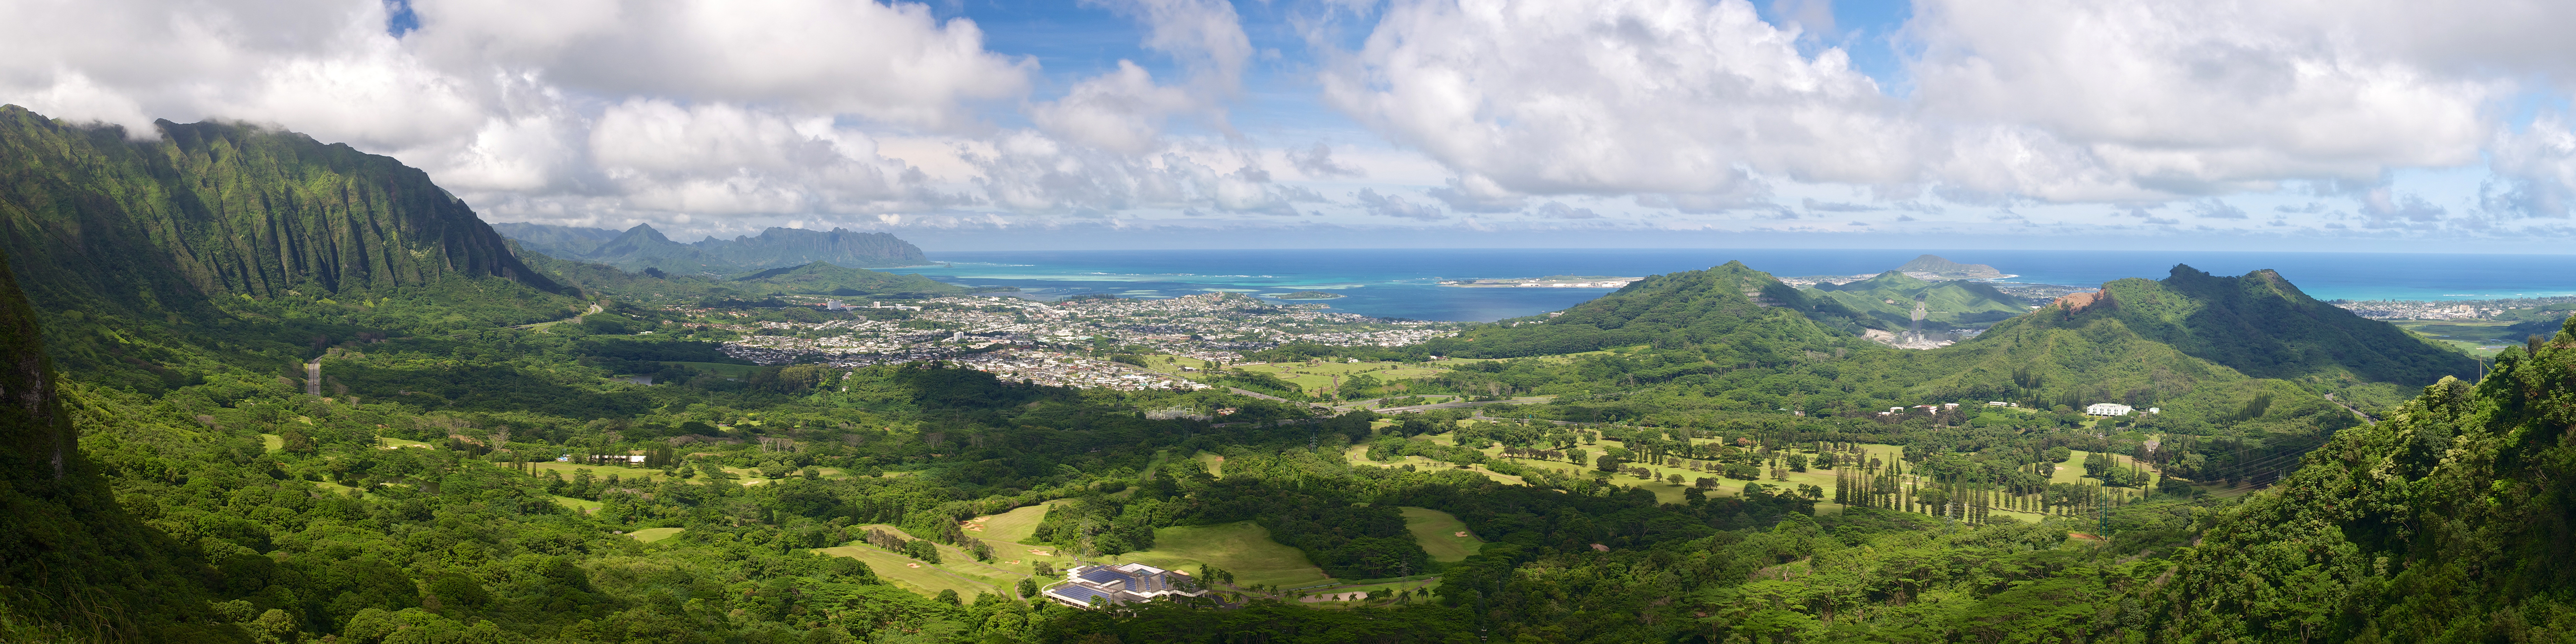
Honolulu
Honolulu (/ˌhɒnəˈluːluː/ or /ˌhoʊnəˈluːluː/; Hawaiian pronunciation: [honoˈlulu]) is the state capital and the most populous city in the U.S. state of Hawaii. It is the county seat of the City and County of Honolulu. Hawaii is a major tourist destina..
Honolulu Wikipedia Page

About Our Data
The data on this page is estimated using a number of publicly available tools and resources. It is provided without warranty, and could contain inaccuracies. Use at your own risk.