Categories in Williston, Florida
Industries
Business Distribution by Industry in Williston, Florida
| Industry Description | Number of Establishments | Average Age of Business |
|---|---|---|
| Health and medical | 79 | 25 years |
| Construction of buildings | 53 | 33 years |
| Shopping | 50 | 32 years |
| Restaurants | 49 | 25 years |
| Religion | 46 | 38 years |
| Car repair | 41 | 29 years |
| Shopping other | 34 | 29 years |
| Physicians and surgeons | 26 | 38 years |
| Landscaping | 24 | 31 years |
| Real estate | 24 | 29 years |
| Freight/commercial transport | 23 | 26 years |
| Tractors and farm equipment | 21 | 26 years |
Williston, Florida Facts
| Area | 6.6 mi² |
| Population | 2,962 |
| Male Population | 1,400 (47.3%) |
| Female Population | 1,562 (52.7%) |
| Population change (1975 to 2020) | +95.5% |
| Population change (2000 to 2020) | +28.3% |
| Median Age | 37.9 years (Male: 35.6, Female: 40.4) |
| Area Codes | 352 |
| Neighborhoods | Williston |
| Local Time | |
| Timezone | Eastern Daylight Time |
| Lat & Lng | 29.38747, -82.44677 |
| Zip Codes | 32696 |
Map of Williston, Florida
Interactive Map
Williston, Florida Population
Years 1975 to 2020
| Data | 1975 | 1990 | 2000 | 2015 | 2020 |
|---|---|---|---|---|---|
| Population | 1,515 | 2,048 | 2,309 | 2,930 | 2,962 |
| Population Density | 229.1 / mi² | 309.7 / mi² | 349.2 / mi² | 443.1 / mi² | 448 / mi² |
Williston, Florida Population change from 2000 to 2015
Increase of 26.9% from year 2000 to 2015
| Location | Change since 1975 | Change since 1990 | Change since 2000 |
|---|---|---|---|
| Williston, Florida | +93.4% | +43.1% | +26.9% |
| Florida | +95.6% | +51.7% | +26.2% |
| United States | +46.9% | +27.2% | +13.7% |
Williston, Florida Median Age
Median Age: 37.9 years
| Location | Median Age | Median Age (Female) | Median Age (Male) |
|---|---|---|---|
| Williston, Florida | 37.9 yrs | 40.4 yrs | 35.6 yrs |
| Florida | 41.8 yrs | 43.2 yrs | 40.4 yrs |
| United States | 37.4 yrs | 38.7 yrs | 36.1 yrs |
Williston, Florida Population Density
Population Density: 448 / mi²
| Location | Population | Area | Density |
|---|---|---|---|
| Williston, Florida | 2,962 | 6.61 sq mi | 448 / mi² |
| Florida | 20.3 million | 65,757.1 sq mi | 308 / mi² |
| United States | 321.6 million | 3,796,740.8 sq mi | 84.7 / mi² |
Williston, Florida Historical and Projected Population
Estimated Population from 1880 to 2100
- JRC (European Commission's Joint Research Centre) work on the GHS built-up grid
- CIESIN (Center for International Earth Science Information Network)
- [Link] Klein Goldewijk, K., Beusen, A., Doelman, J., and Stehfest, E.: Anthropogenic land use estimates for the Holocene – HYDE 3.2, Earth Syst. Sci. Data, 9, 927–953, https://doi.org/10.5194/essd-9-927-2017, 2017.
Price Distribution
Business distribution by price for Williston, Florida
Human Development Index (HDI)
Statistic composite index of life expectancy, education, and per capita income.
Williston, Florida CO2 Emissions
Carbon Dioxide (CO2) Emissions Per Capita in Tonnes Per Year
| Location | CO2 Emissions | CO2 Emissions Per Capita | CO2 Emissions Intensity |
|---|---|---|---|
| Williston, Florida | 46,392 tn | 15.66 tn | 7,016.3 tons/mi² |
| Florida | 302,482,610 tn | 14.93 tn | 4,600 tons/mi² |
| United States | 5,664,619,810 tn | 17.62 tn | 1,492 tons/mi² |
| 2013 CO2 emissions (tonnes/year) | 46,392 tn |
| 2013 CO2 emissions (tonnes/year) per capita | 15.66 tn |
| 2013 CO2 emissions intensity (tonnes/mi²/year) | 7,016.3 tons/mi² |
Natural Hazards Risk
Relative risk out of 10
| Hazard | Risk Level |
|---|---|
| Flood | Medium (4) |
* Risk, particularly concerning flood or landslide, may not be for the entire area.
- Dilley, M., R.S. Chen, U. Deichmann, A.L. Lerner-Lam, M. Arnold, J. Agwe, P. Buys, O. Kjekstad, B. Lyon, and G. Yetman. 2005. Natural Disaster Hotspots: A Global Risk Analysis. Washington, D.C.: World Bank. https://doi.org/10.1596/0-8213-5930-4.
- Center for Hazards and Risk Research - CHRR - Columbia University, Center for International Earth Science Information Network - CIESIN - Columbia University. 2005. Global Flood Hazard Frequency and Distribution. Palisades, NY: NASA Socioeconomic Data and Applications Center (SEDAC). https://doi.org/10.7927/H4668B3D.
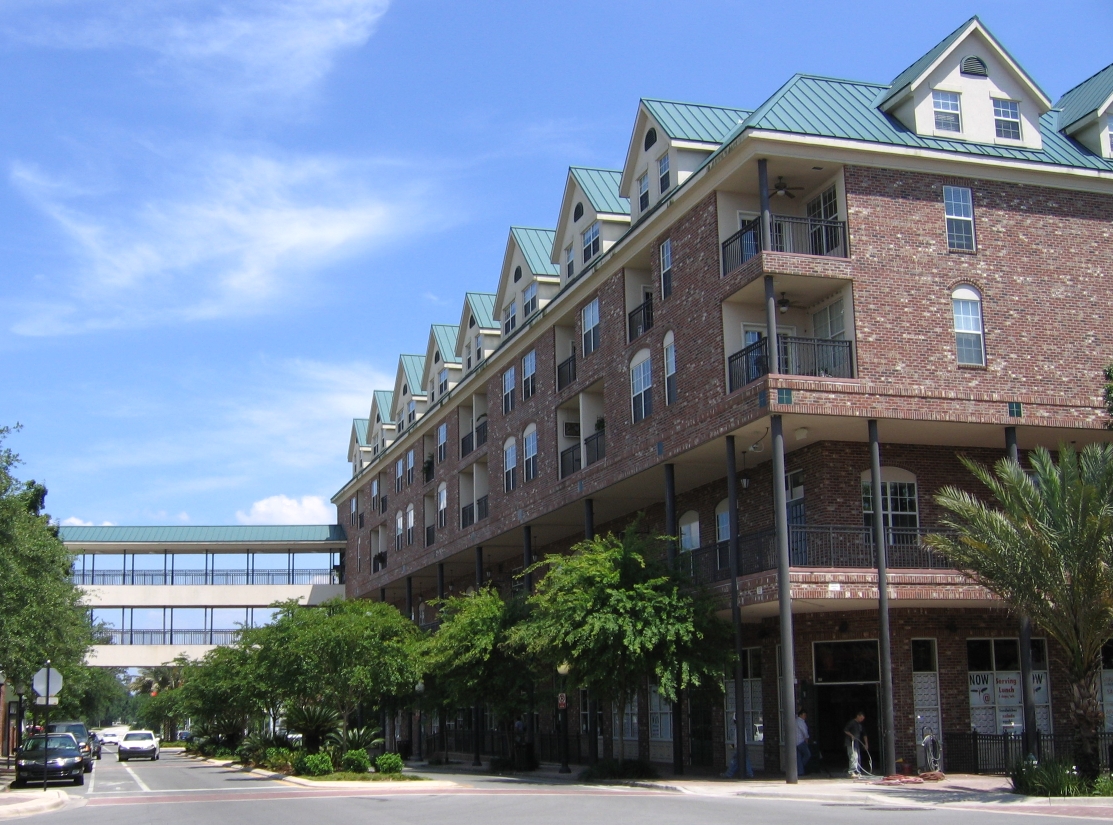
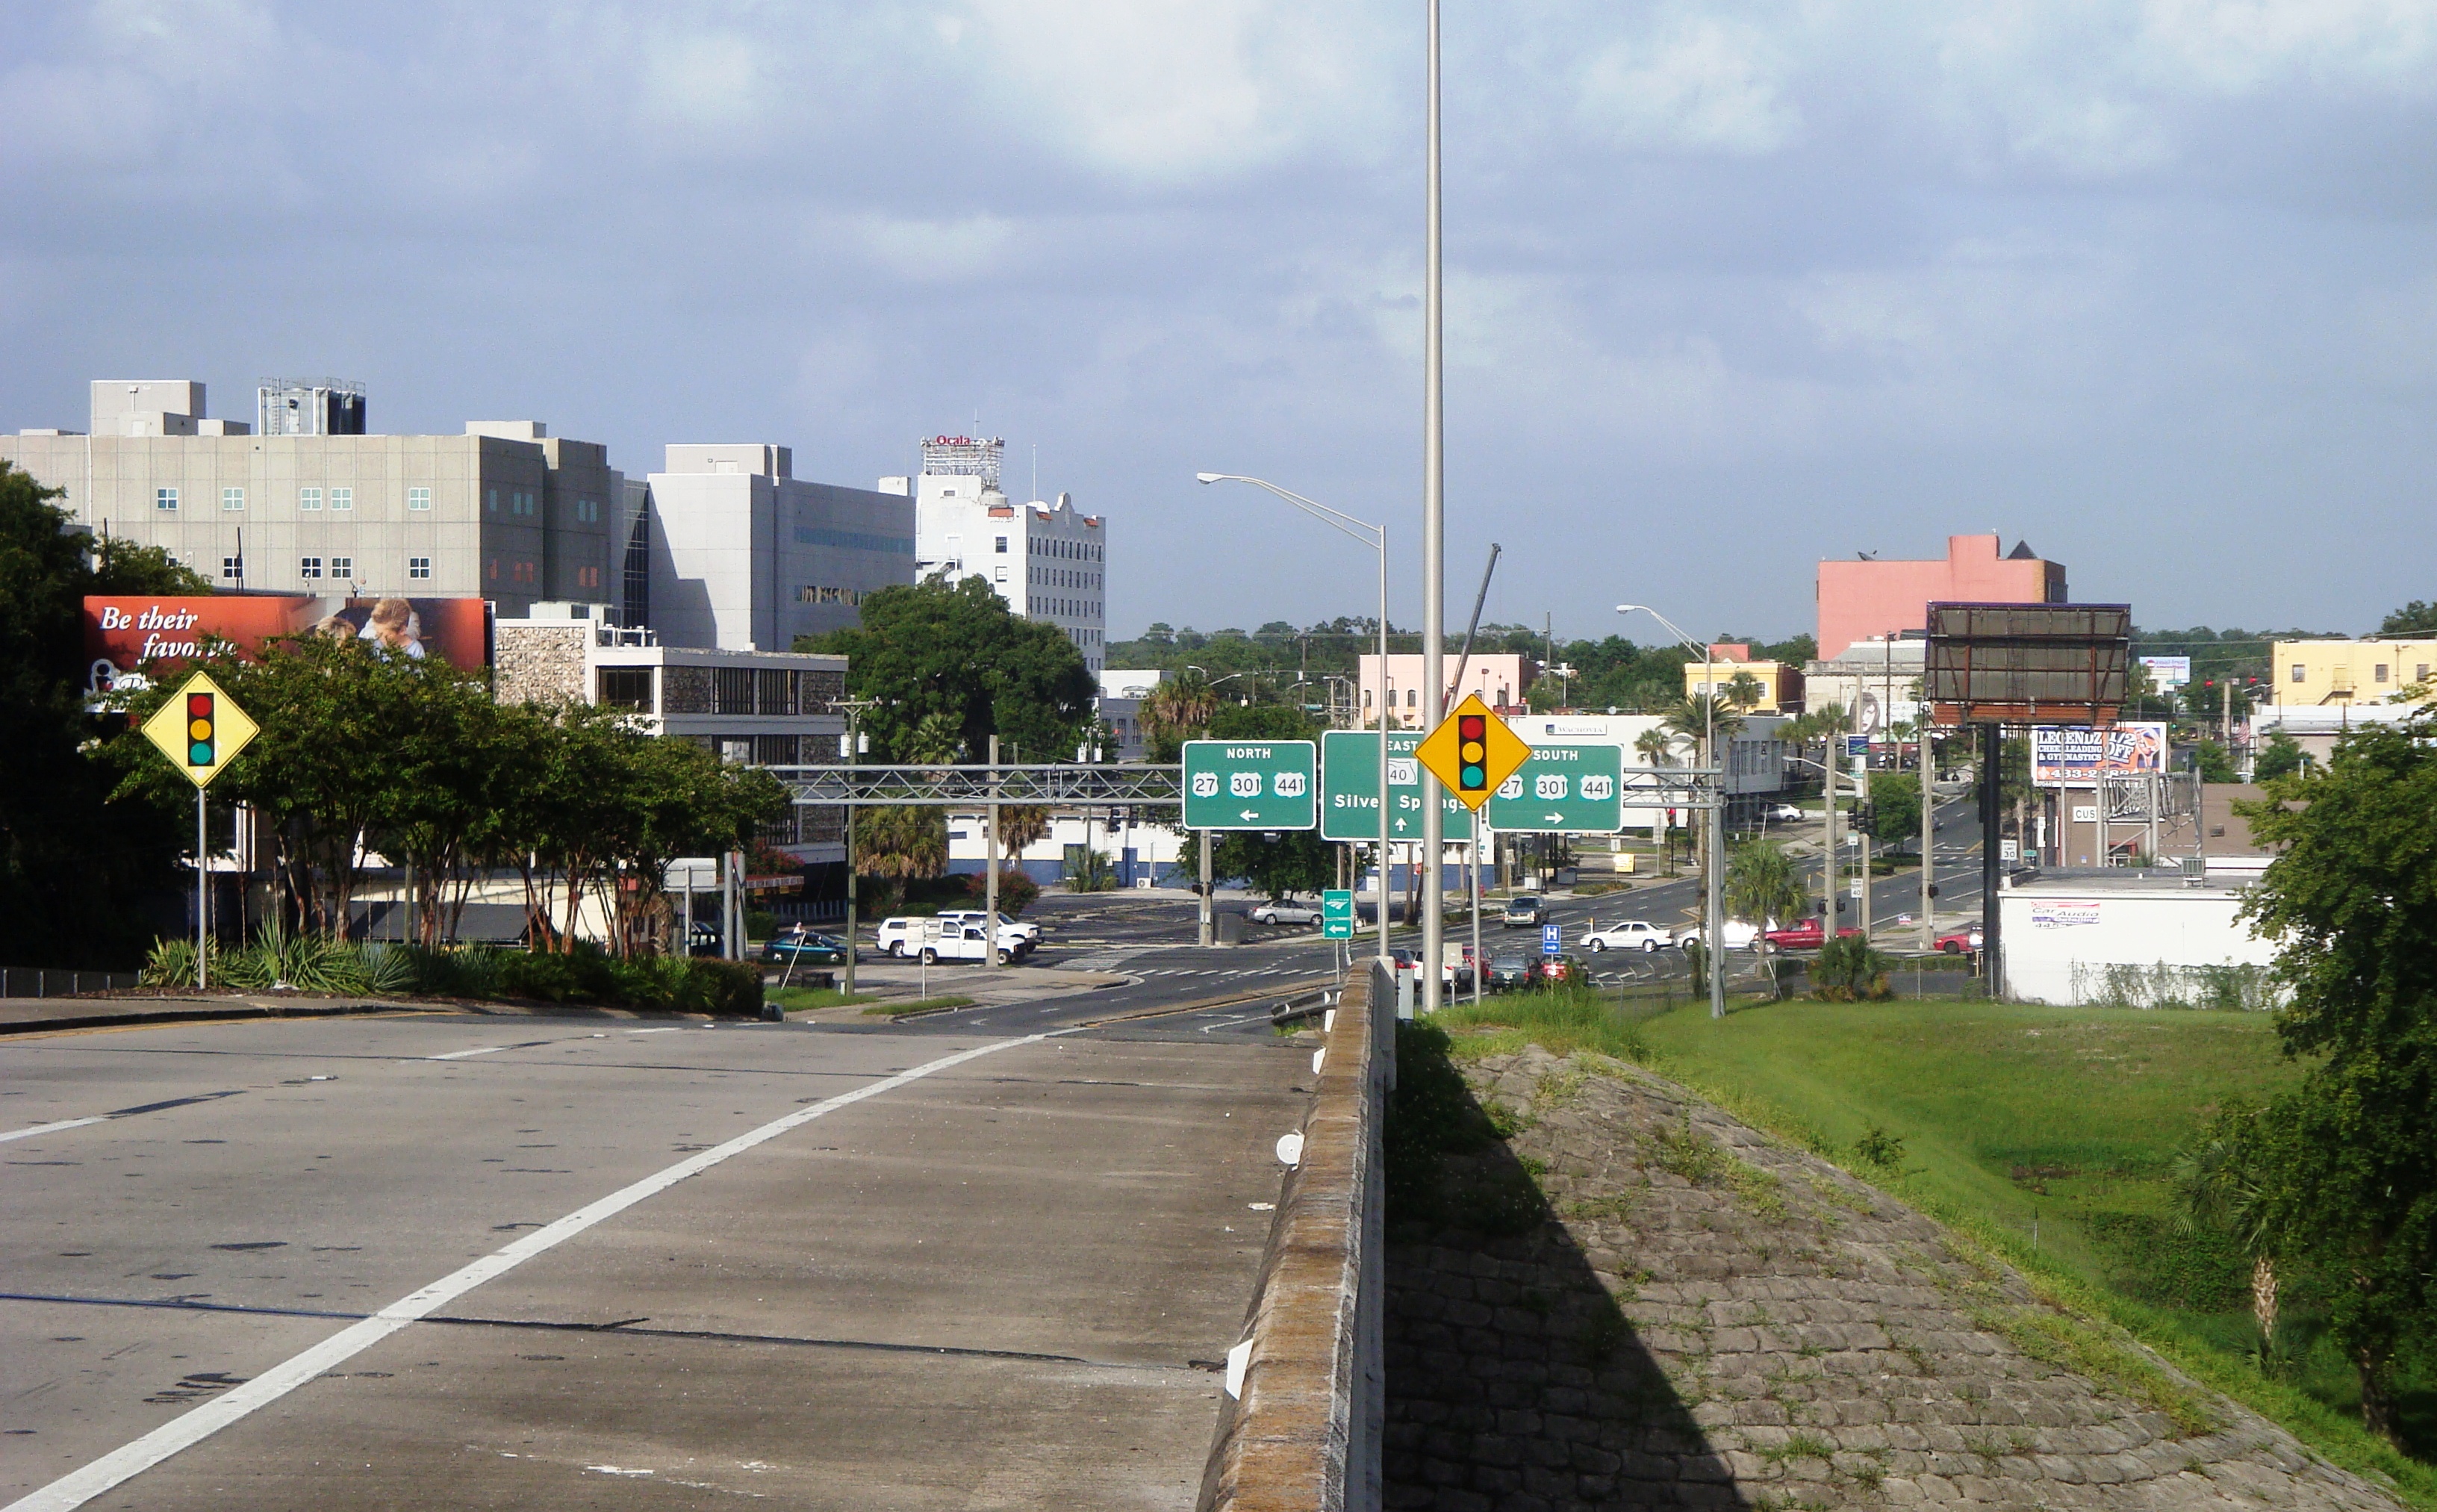
Williston, Florida
Williston is a city in Levy County, Florida, United States. As of the 2010 census it had a population of 2,768.
Williston, Florida Wikipedia Page

About Our Data
The data on this page is estimated using a number of publicly available tools and resources. It is provided without warranty, and could contain inaccuracies. Use at your own risk.