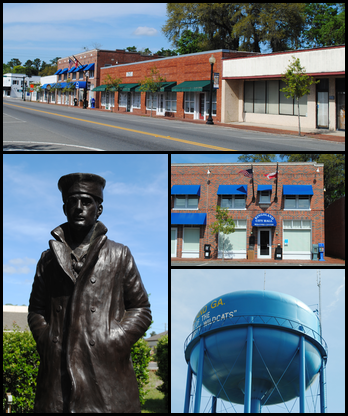
Categories in Yulee
Auto glassAuto Parts StoreBody repairBrake ShopCar Accessories StoreCar Battery StoreCar Detailing ServiceCar repairCar Repair and MaintenanceCar WashGas StationNew car dealersOil Change ServiceTire ShopTowing Equipment ProviderTrailer Supply StoreTruck Accessories StoreTrucks and trailer rentalTrucks and trailersUsed car dealersBottled Water SupplierBuilding Materials SupplierDiesel Fuel SupplierFarmingOffice Supply StorePropane SupplierWelderCleanersClothing storesDry CleanerShoe storesWomen's clothingInternet Service ProviderMobile phone storesTelecommunications Service ProviderTelephone CompanyAssociation or OrganizationBaptist ChurchChild Care AgencyChurchesCommunity CenterCounselorCounty Government OfficeDonations CenterFraternal OrganizationGarbage Collection ServiceGovernment OfficeMailing ServiceNon-Profit OrganizationPublic Health Department
Showing 1-50 of 269
…
Industries
Business Distribution by Industry in Yulee
| Industry Description | Number of Establishments | Average Age of Business |
|---|---|---|
| Health and medical | 106 | 22 years |
| Restaurants | 103 | 30 years |
| Construction of buildings | 84 | 23 years |
| Dentists | 68 | 16 years |
| Real estate | 66 | 22 years |
| Shopping | 65 | 24 years |
| Public administration | 61 | 30 years |
| Other construction | 52 | 30 years |
| Religion | 51 | 40 years |
| Car repair | 49 | 34 years |
| Landscaping | 48 | 21 years |
| Shopping other | 43 | 28 years |
| Corporate management | 42 | 20 years |
| Gas station | 39 | 17 years |
| General contractors | 38 | 24 years |
Yulee Facts
| Area | 23.3 mi² |
| Population | 13,302 |
| Male Population | 6,649 (50.0%) |
| Female Population | 6,653 (50.0%) |
| Population change (1975 to 2020) | +118.6% |
| Population change (2000 to 2020) | +46.8% |
| Median Age | 37.7 years (Male: 36.9, Female: 38.6) |
| Area Codes | 904 |
| Neighborhoods | Northside, Yulee, Greater Arlington, Riverside, Southside |
| Local Time | |
| Timezone | Eastern Daylight Time |
| Lat & Lng | 30.63190, -81.60649 |
| Zip Codes | 32041, 32097 |
Map of Yulee
Interactive Map
Yulee Population
Years 1975 to 2020
| Data | 1975 | 1990 | 2000 | 2015 | 2020 |
|---|---|---|---|---|---|
| Population | 6,084 | 7,946 | 9,061 | 12,799 | 13,302 |
| Population Density | 261 / mi² | 340.9 / mi² | 388.7 / mi² | 549.1 / mi² | 570.6 / mi² |
Sources: JRC (European Commission's Joint Research Centre) work on the GHS built-up grid
Yulee Population change from 2000 to 2015
Increase of 41.3% from year 2000 to 2015
| Location | Change since 1975 | Change since 1990 | Change since 2000 |
|---|---|---|---|
| Yulee | +110.4% | +61.1% | +41.3% |
| Florida | +95.6% | +51.7% | +26.2% |
| United States | +46.9% | +27.2% | +13.7% |
Sources: JRC (European Commission's Joint Research Centre) work on the GHS built-up grid
Yulee Median Age
Median Age: 37.7 years
| Location | Median Age | Median Age (Female) | Median Age (Male) |
|---|---|---|---|
| Yulee | 37.7 yrs | 38.6 yrs | 36.9 yrs |
| Florida | 41.8 yrs | 43.2 yrs | 40.4 yrs |
| United States | 37.4 yrs | 38.7 yrs | 36.1 yrs |
Sources: CIESIN (Center for International Earth Science Information Network)
Yulee Population Density
Population Density: 571 / mi²
| Location | Population | Area | Density |
|---|---|---|---|
| Yulee | 13,302 | 23.31 sq mi | 571 / mi² |
| Florida | 20.3 million | 65,757.1 sq mi | 308 / mi² |
| United States | 321.6 million | 3,796,740.8 sq mi | 84.7 / mi² |
Sources: JRC (European Commission's Joint Research Centre) work on the GHS built-up grid
Yulee Historical and Projected Population
Estimated Population from 1890 to 2100
Sources:
- JRC (European Commission's Joint Research Centre) work on the GHS built-up grid
- CIESIN (Center for International Earth Science Information Network)
- [Link] Klein Goldewijk, K., Beusen, A., Doelman, J., and Stehfest, E.: Anthropogenic land use estimates for the Holocene – HYDE 3.2, Earth Syst. Sci. Data, 9, 927–953, https://doi.org/10.5194/essd-9-927-2017, 2017.
Neighborhoods in Yulee
Percentage of businesses by neighborhood in Yulee
Price Distribution
Business distribution by price for Yulee
Human Development Index (HDI)
Statistic composite index of life expectancy, education, and per capita income.
Source: [Link] Kummu, M., Taka, M. &Guillaume, J. Gridded global datasets for Gross Domestic Product and Human Development Index over 1990–2015. Sci Data 5, 180004 (2018) doi:10.1038/sdata.2018.4
Yulee CO2 Emissions
Carbon Dioxide (CO2) Emissions Per Capita in Tonnes Per Year
| Location | CO2 Emissions | CO2 Emissions Per Capita | CO2 Emissions Intensity |
|---|---|---|---|
| Yulee | 214,190 tn | 16.1 tn | 9,188.4 tons/mi² |
| Florida | 302,482,610 tn | 14.93 tn | 4,600 tons/mi² |
| United States | 5,664,619,810 tn | 17.62 tn | 1,492 tons/mi² |
Sources: [Link] Moran, D., Kanemoto K; Jiborn, M., Wood, R., Többen, J., and Seto, K.C. (2018) Carbon footprints of 13,000 cities. Environmental Research Letters DOI: 10.1088/1748-9326/aac72a
Yulee CO2 Emissions
| 2013 CO2 emissions (tonnes/year) | 214,190 tn |
| 2013 CO2 emissions (tonnes/year) per capita | 16.1 tn |
| 2013 CO2 emissions intensity (tonnes/mi²/year) | 9,188.4 tons/mi² |
Natural Hazards Risk
Relative risk out of 10
| Hazard | Risk Level |
|---|---|
| Flood | Medium (4) |
| Cyclone | Medium (5) |
* Risk, particularly concerning flood or landslide, may not be for the entire area.
Sources:
- Dilley, M., R.S. Chen, U. Deichmann, A.L. Lerner-Lam, M. Arnold, J. Agwe, P. Buys, O. Kjekstad, B. Lyon, and G. Yetman. 2005. Natural Disaster Hotspots: A Global Risk Analysis. Washington, D.C.: World Bank. https://doi.org/10.1596/0-8213-5930-4.
- Center for Hazards and Risk Research - CHRR - Columbia University, Center for International Earth Science Information Network - CIESIN - Columbia University, International Bank for Reconstruction and Development - The World Bank, and United Nations Environment Programme Global Resource Information Database Geneva - UNEP/GRID-Geneva. 2005. Global Cyclone Hazard Frequency and Distribution. Palisades, NY: NASA Socioeconomic Data and Applications Center (SEDAC). https://doi.org/10.7927/H4CZ353K.
- Center for Hazards and Risk Research - CHRR - Columbia University, Center for International Earth Science Information Network - CIESIN - Columbia University. 2005. Global Flood Hazard Frequency and Distribution. Palisades, NY: NASA Socioeconomic Data and Applications Center (SEDAC). https://doi.org/10.7927/H4668B3D.

About Our Data
The data on this page is estimated using a number of publicly available tools and resources. It is provided without warranty, and could contain inaccuracies. Use at your own risk.