Categories in Bejuma
Industries
Business Distribution by Industry in Bejuma
| Industry Description | Number of Establishments |
|---|---|
| Restaurants | 53 |
| Shopping | 49 |
| Grocery stores and supermarkets | 41 |
| Education | 32 |
| Corporate management | 22 |
| Hotels and motels | 20 |
| Car repair | 19 |
| Bakeries | 16 |
| Bars, pubs and taverns | 16 |
| Car parts | 16 |
| Cafes | 15 |
| Clothing stores | 15 |
| Pharmacies and drug stores | 15 |
Bejuma Facts
| Area | 552.4 km² |
| Population | 73,253 |
| Male Population | 36,882 (50.3%) |
| Female Population | 36,371 (49.7%) |
| Population change (1975 to 2020) | +213.2% |
| Population change (2000 to 2020) | +44.7% |
| Median Age | 27.3 years (Male: 27, Female: 27.7) |
| Local Time | |
| Timezone | Venezuela Time |
| Lat & Lng | 10.17309, -68.25887 |
| Postal Codes | 2040, 2044 |
Map of Bejuma
Interactive Map
Bejuma Population
Years 1975 to 2020
| Data | 1975 | 1990 | 2000 | 2015 | 2020 |
|---|---|---|---|---|---|
| Population | 23,387 | 39,013 | 50,640 | 68,315 | 73,253 |
| Population Density | 42.3 / km² | 70.6 / km² | 91.7 / km² | 123.7 / km² | 132.6 / km² |
Bejuma Population change from 2000 to 2015
Increase of 34.9% from year 2000 to 2015
| Location | Change since 1975 | Change since 1990 | Change since 2000 |
|---|---|---|---|
| Bejuma | +192.1% | +75.1% | +34.9% |
| Carabobo | +149.3% | +64.9% | +32.3% |
| Venezuela | +132.7% | +56.6% | +27% |
Bejuma Median Age
Median Age: 27.3 years
| Location | Median Age | Median Age (Female) | Median Age (Male) |
|---|---|---|---|
| Bejuma | 27.3 yrs | 27.7 yrs | 27 yrs |
| Carabobo | 28 yrs | 28.6 yrs | 27.3 yrs |
| Venezuela | 27.3 yrs | 27.9 yrs | 26.6 yrs |
Bejuma Population Density
Population Density: 133 / km²
| Location | Population | Area | Density |
|---|---|---|---|
| Bejuma | 73,253 | 552.4 km² | 133 / km² |
| Carabobo | 2.6 million | 5,137.2 km² | 498 / km² |
| Venezuela | 30.8 million | 912,498.1 km² | 33.7 / km² |
Bejuma Historical and Projected Population
Estimated Population from 0 to 2100
- JRC (European Commission's Joint Research Centre) work on the GHS built-up grid
- CIESIN (Center for International Earth Science Information Network)
- [Link] Klein Goldewijk, K., Beusen, A., Doelman, J., and Stehfest, E.: Anthropogenic land use estimates for the Holocene – HYDE 3.2, Earth Syst. Sci. Data, 9, 927–953, https://doi.org/10.5194/essd-9-927-2017, 2017.
Area Codes
Percentage Area Codes used by businesses in Bejuma
Price Distribution
Business distribution by price for Bejuma
Human Development Index (HDI)
Statistic composite index of life expectancy, education, and per capita income.
Bejuma CO2 Emissions
Carbon Dioxide (CO2) Emissions Per Capita in Tonnes Per Year
| Location | CO2 Emissions | CO2 Emissions Per Capita | CO2 Emissions Intensity |
|---|---|---|---|
| Bejuma | 433,110 tn | 5.91 tn | 784 tons/km² |
| Carabobo | 14,985,715 tn | 5.85 tn | 2,917.1 tons/km² |
| Venezuela | 161,060,019 tn | 5.23 tn | 176.5 tons/km² |
| 2013 CO2 emissions (tonnes/year) | 433,110 tn |
| 2013 CO2 emissions (tonnes/year) per capita | 5.91 tn |
| 2013 CO2 emissions intensity (tonnes/km²/year) | 784 tons/km² |
Natural Hazards Risk
Relative risk out of 10
| Hazard | Risk Level |
|---|---|
| Drought | Medium (4) |
| Flood | High (8) |
| Earthquake | Medium (6.9) |
| Landslide | Medium (6) |
* Risk, particularly concerning flood or landslide, may not be for the entire area.
- Dilley, M., R.S. Chen, U. Deichmann, A.L. Lerner-Lam, M. Arnold, J. Agwe, P. Buys, O. Kjekstad, B. Lyon, and G. Yetman. 2005. Natural Disaster Hotspots: A Global Risk Analysis. Washington, D.C.: World Bank. https://doi.org/10.1596/0-8213-5930-4.
- Center for Hazards and Risk Research - CHRR - Columbia University, Center for International Earth Science Information Network - CIESIN - Columbia University, and Norwegian Geotechnical Institute - NGI. 2005. Global Landslide Hazard Distribution. Palisades, NY: NASA Socioeconomic Data and Applications Center (SEDAC). https://doi.org/10.7927/H4P848VZ.
- Center for Hazards and Risk Research - CHRR - Columbia University, Center for International Earth Science Information Network - CIESIN - Columbia University, and International Research Institute for Climate and Society - IRI - Columbia University. 2005. Global Drought Hazard Frequency and Distribution. Palisades, NY: NASA Socioeconomic Data and Applications Center (SEDAC). https://doi.org/10.7927/H4VX0DFT.
- Center for Hazards and Risk Research - CHRR - Columbia University, Center for International Earth Science Information Network - CIESIN - Columbia University. 2005. Global Flood Hazard Frequency and Distribution. Palisades, NY: NASA Socioeconomic Data and Applications Center (SEDAC). https://doi.org/10.7927/H4668B3D.
- Center for Hazards and Risk Research - CHRR - Columbia University, Center for International Earth Science Information Network - CIESIN - Columbia University. 2005. Global Earthquake Hazard Distribution - Peak Ground Acceleration. Palisades, NY: NASA Socioeconomic Data and Applications Center (SEDAC). https://doi.org/10.7927/H4BZ63ZS.
Recent Nearby Earthquakes
Magnitude 3.0 and greater
| Date▼ | Time↕ | Magnitude↕ | Distance↕ | Depth↕ | Location↕ | Link |
|---|---|---|---|---|---|---|
| 4/16/19 | 8:40 AM | 3.5 | 35.8 km | 10,000 m | 2km SE of San Diego, Venezuela | usgs.gov |
| 1/29/19 | 7:33 AM | 4.1 | 36 km | 18,550 m | 1km NE of San Diego, Venezuela | usgs.gov |
| 12/27/18 | 9:24 AM | 4.9 | 35.1 km | 10,000 m | 0km SSE of San Diego, Venezuela | usgs.gov |
| 12/27/18 | 9:13 AM | 4.2 | 47.8 km | 10,000 m | 9km NW of San Joaquin, Venezuela | usgs.gov |
| 12/27/18 | 8:59 AM | 5.4 | 40.2 km | 8,000 m | 5km NW of Guacara, Venezuela | usgs.gov |
| 12/5/18 | 9:33 AM | 4.7 | 55.7 km | 10,000 m | 9km WNW of Farriar, Venezuela | usgs.gov |
| 10/28/18 | 10:58 PM | 4.4 | 90.8 km | 20,330 m | 9km ESE of Duaca, Venezuela | usgs.gov |
| 5/23/18 | 11:23 AM | 4.2 | 36.9 km | 10,000 m | 7km N of San Diego, Venezuela | usgs.gov |
| 4/27/18 | 8:44 AM | 4.7 | 32.6 km | 10,000 m | 4km NE of Naguanagua, Venezuela | usgs.gov |
| 8/16/14 | 12:39 PM | 4 | 74.4 km | 7,700 m | 12km ENE of Ocumare de la Costa, Venezuela | usgs.gov |
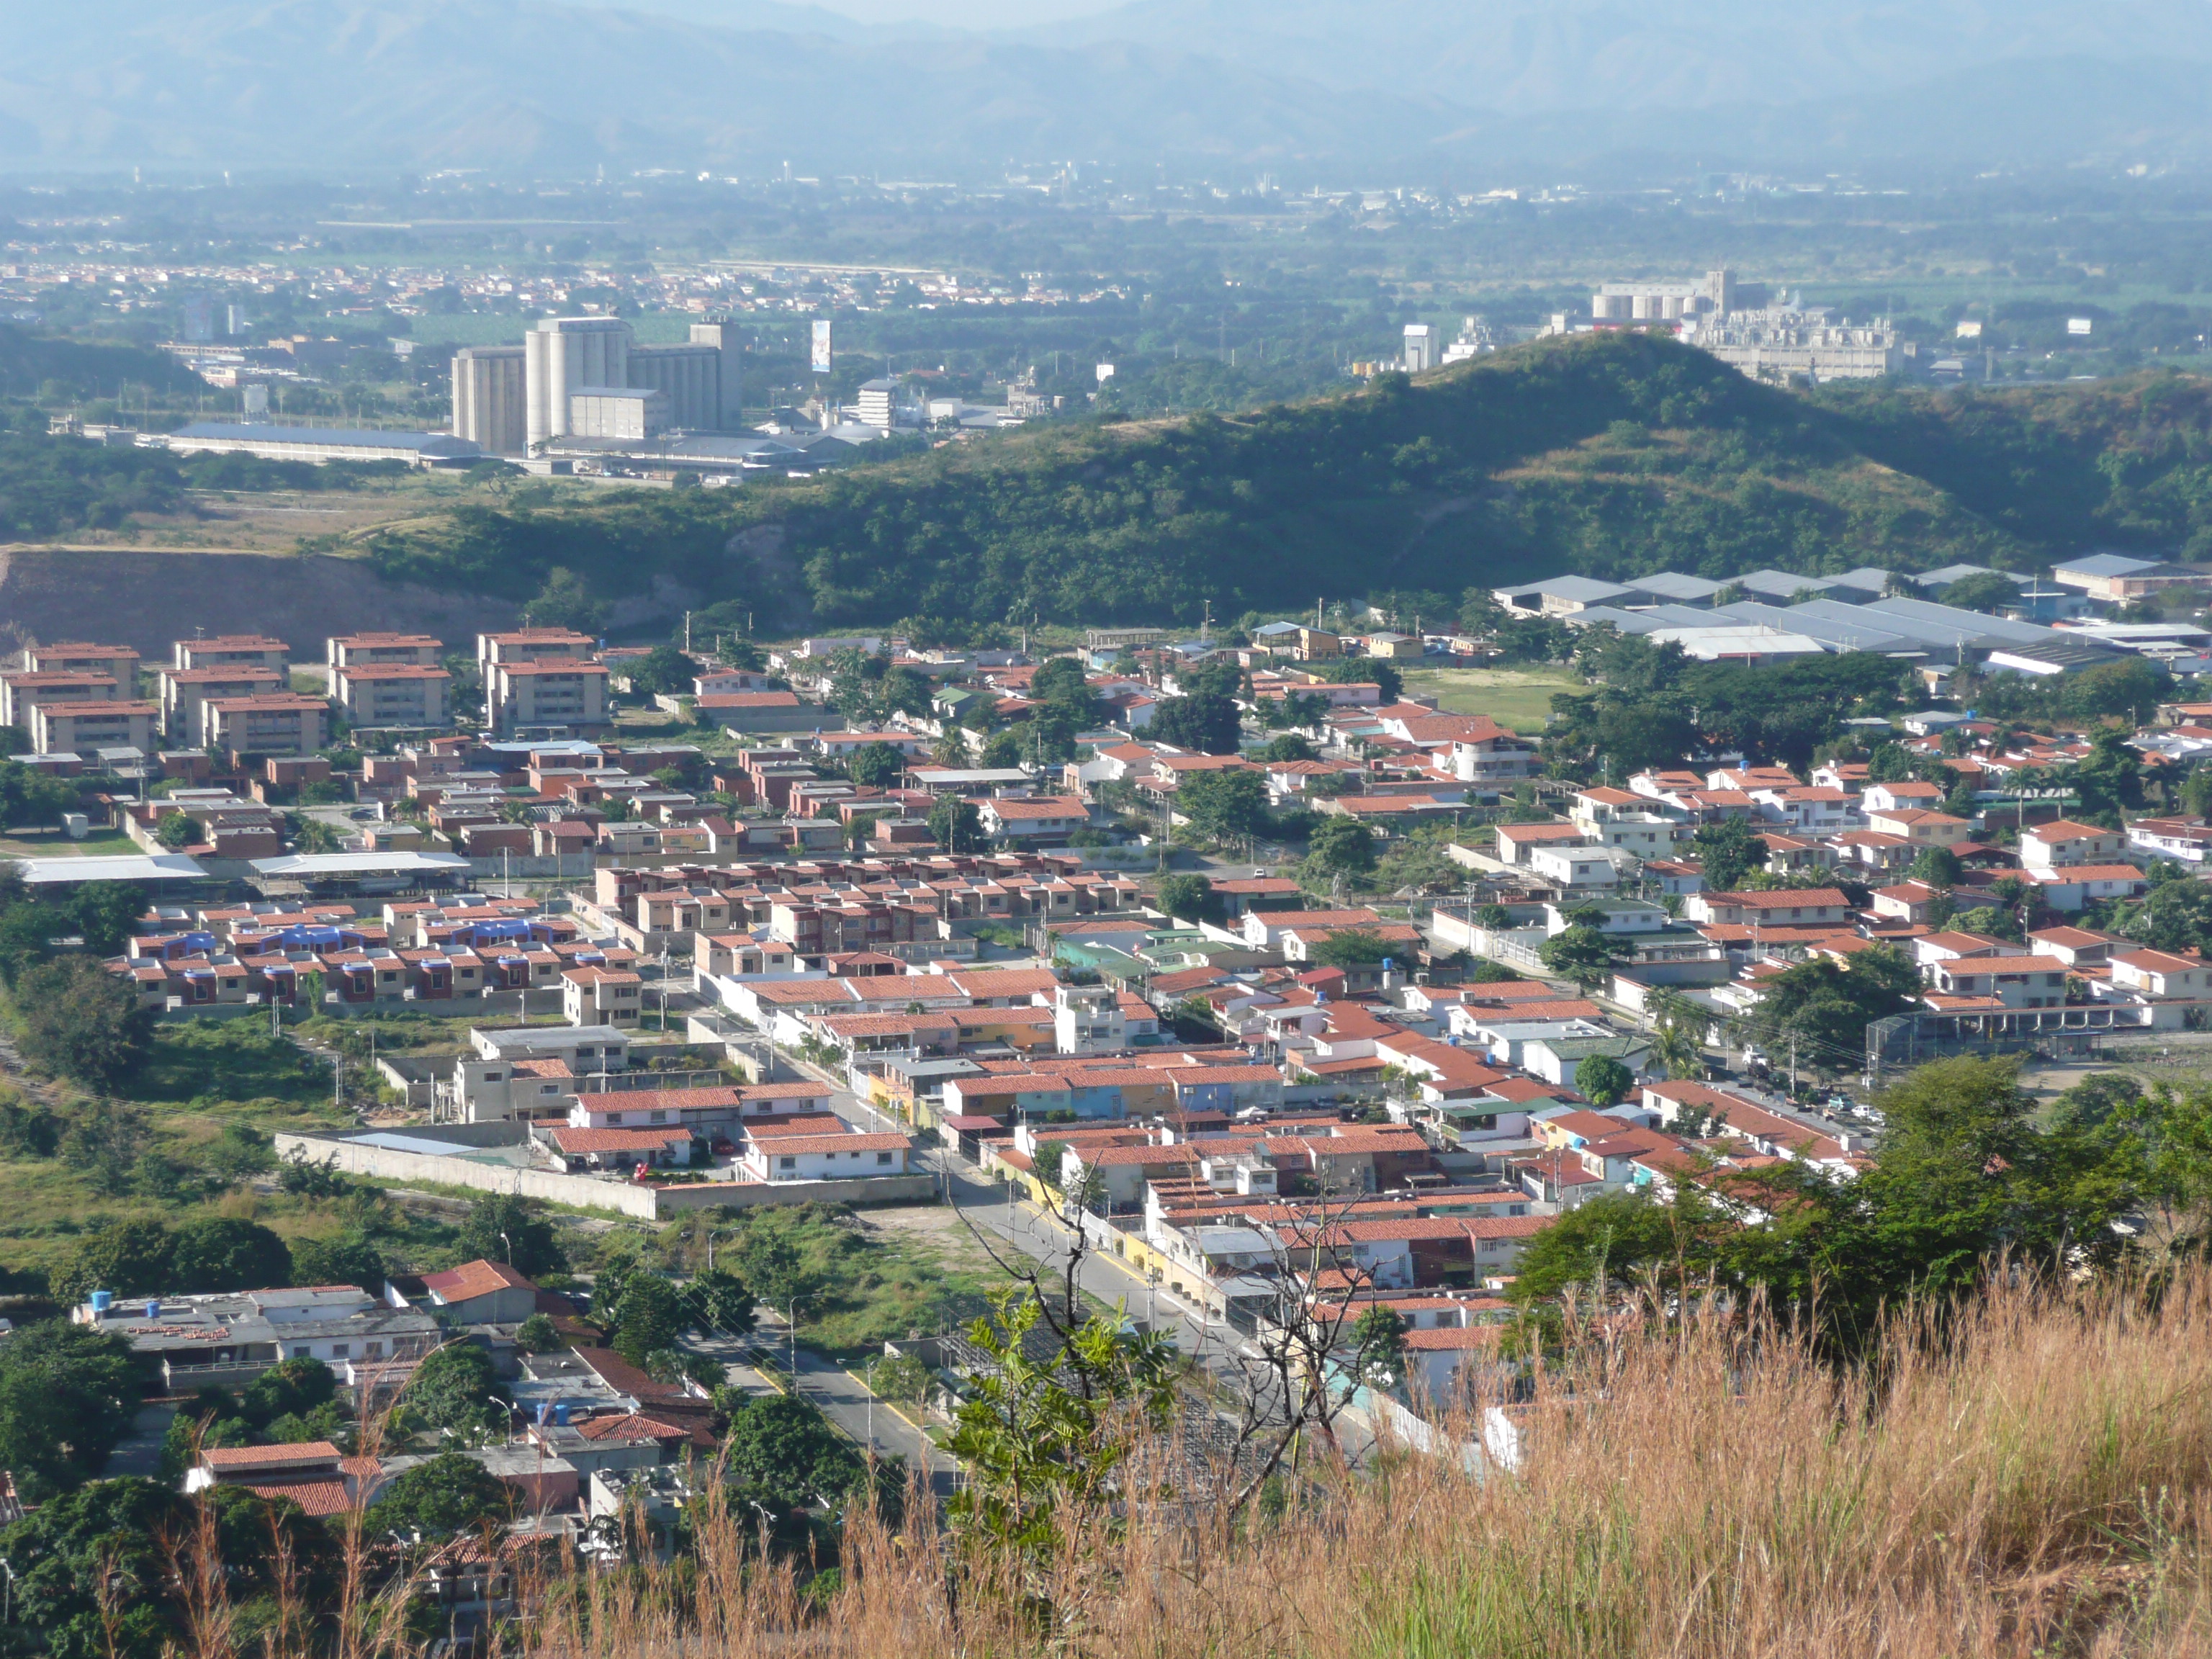
Bejuma
Bejuma is a small town in Carabobo State, Venezuela, seat of the Bejuma Municipality.
Bejuma Wikipedia Page

About Our Data
The data on this page is estimated using a number of publicly available tools and resources. It is provided without warranty, and could contain inaccuracies. Use at your own risk.