Categories in Fourways
Industries
Business Distribution by Industry in Fourways
| Industry Description | Number of Establishments |
|---|---|
| Corporate management | 32 |
| Shopping | 22 |
| Real estate | 20 |
| Shopping other | 19 |
| Electronics stores | 12 |
| Restaurants | 9 |
| Advertising and marketing | 9 |
| Wholesale of machinery | 8 |
| Other accommodation | 8 |
Fourways Facts
| Area | 21.8 km² |
| Population | 58,685 |
| Male Population | 27,178 (46.3%) |
| Female Population | 31,507 (53.7%) |
| Population change (1975 to 2020) | +370.8% |
| Population change (2000 to 2020) | +64.6% |
| Median Age | 33.7 years (Male: 33, Female: 34.3) |
| Neighborhoods | Fourways, Witkoppen, Magaliessig, Broadacres AH, Douglasdale |
| Local Time | |
| Timezone | South Africa Standard Time |
| Lat & Lng | -26.02111, 28.00917 |
| Postal Codes | 1234, 2062, 2067, 2086, 2165 |
Map of Fourways
Interactive Map
Fourways Population
Years 1975 to 2020
| Data | 1975 | 1990 | 2000 | 2015 | 2020 |
|---|---|---|---|---|---|
| Population | 12,465 | 24,657 | 35,661 | 55,547 | 58,685 |
| Population Density | 573.1 / km² | 1,133.7 / km² | 1,639.6 / km² | 2,553.9 / km² | 2,698.2 / km² |
Fourways Population change from 2000 to 2015
Increase of 55.8% from year 2000 to 2015
| Location | Change since 1975 | Change since 1990 | Change since 2000 |
|---|---|---|---|
| Fourways | +345.6% | +125.3% | +55.8% |
| Gauteng | +262.9% | +103.1% | +45.4% |
| South Africa | +111.9% | +48.1% | +21.4% |
Fourways Median Age
Median Age: 33.7 years
| Location | Median Age | Median Age (Female) | Median Age (Male) |
|---|---|---|---|
| Fourways | 33.7 yrs | 34.3 yrs | 33 yrs |
| Gauteng | 28.1 yrs | 28.2 yrs | 28.1 yrs |
| South Africa | 25.4 yrs | 26.3 yrs | 24.5 yrs |
Fourways Population Density
Population Density: 2,698 / km²
| Location | Population | Area | Density |
|---|---|---|---|
| Fourways | 58,685 | 21.8 km² | 2,698 / km² |
| Gauteng | 13.5 million | 18,178.3 km² | 744 / km² |
| South Africa | 54.3 million | 1,219,846.5 km² | 44.5 / km² |
Fourways Historical and Projected Population
Estimated Population from 1890 to 2100
- JRC (European Commission's Joint Research Centre) work on the GHS built-up grid
- CIESIN (Center for International Earth Science Information Network)
- [Link] Klein Goldewijk, K., Beusen, A., Doelman, J., and Stehfest, E.: Anthropogenic land use estimates for the Holocene – HYDE 3.2, Earth Syst. Sci. Data, 9, 927–953, https://doi.org/10.5194/essd-9-927-2017, 2017.
Neighborhoods in Fourways
Percentage of businesses by neighborhood in Fourways
Area Codes
Percentage Area Codes used by businesses in Fourways
Postal Codes
Percentage of businesses by Postal Codes in Fourways
Price Distribution
Business distribution by price for Fourways
Human Development Index (HDI)
Statistic composite index of life expectancy, education, and per capita income.
Fourways CO2 Emissions
Carbon Dioxide (CO2) Emissions Per Capita in Tonnes Per Year
| Location | CO2 Emissions | CO2 Emissions Per Capita | CO2 Emissions Intensity |
|---|---|---|---|
| Fourways | 616,718 tn | 10.51 tn | 28,354.9 tons/km² |
| Gauteng | 126,172,862 tn | 9.33 tn | 6,940.8 tons/km² |
| South Africa | 358,473,408 tn | 6.6 tn | 293.9 tons/km² |
| 2013 CO2 emissions (tonnes/year) | 616,718 tn |
| 2013 CO2 emissions (tonnes/year) per capita | 10.51 tn |
| 2013 CO2 emissions intensity (tonnes/km²/year) | 28,354.9 tons/km² |
Natural Hazards Risk
Relative risk out of 10
| Hazard | Risk Level |
|---|---|
| Drought | Medium (5) |
* Risk, particularly concerning flood or landslide, may not be for the entire area.
- Dilley, M., R.S. Chen, U. Deichmann, A.L. Lerner-Lam, M. Arnold, J. Agwe, P. Buys, O. Kjekstad, B. Lyon, and G. Yetman. 2005. Natural Disaster Hotspots: A Global Risk Analysis. Washington, D.C.: World Bank. https://doi.org/10.1596/0-8213-5930-4.
- Center for Hazards and Risk Research - CHRR - Columbia University, Center for International Earth Science Information Network - CIESIN - Columbia University, and International Research Institute for Climate and Society - IRI - Columbia University. 2005. Global Drought Hazard Frequency and Distribution. Palisades, NY: NASA Socioeconomic Data and Applications Center (SEDAC). https://doi.org/10.7927/H4VX0DFT.
Recent Nearby Earthquakes
Magnitude 3.0 and greater
| Date▼ | Time↕ | Magnitude↕ | Distance↕ | Depth↕ | Location↕ | Link |
|---|---|---|---|---|---|---|
| 3/1/19 | 4:56 AM | 4.9 | 35.5 km | 5,000 m | 6km WSW of Soweto, South Africa | usgs.gov |
| 6/29/18 | 1:17 AM | 4.5 | 60.2 km | 5,000 m | 13km SSW of Westonaria, South Africa | usgs.gov |
| 6/28/18 | 4:10 PM | 4.3 | 62.8 km | 5,000 m | 16km E of Fochville, South Africa | usgs.gov |
| 3/17/18 | 7:42 PM | 4 | 60.8 km | 5,000 m | 11km SW of Westonaria, South Africa | usgs.gov |
| 2/20/18 | 5:23 PM | 4.5 | 39 km | 5,000 m | 7km SSW of Soweto, South Africa | usgs.gov |
| 2/17/18 | 5:16 AM | 4.2 | 51.8 km | 5,000 m | 8km WNW of Orange Farm, South Africa | usgs.gov |
| 1/23/18 | 7:47 PM | 4.4 | 34.5 km | 5,000 m | 4km WSW of Soweto, South Africa | usgs.gov |
| 7/25/17 | 4:18 AM | 4.4 | 62 km | 5,000 m | 14km E of Fochville, South Africa | usgs.gov |
| 2/7/17 | 2:02 PM | 4.4 | 53.1 km | 5,000 m | 7km WNW of Westonaria, South Africa | usgs.gov |
| 2/25/15 | 5:13 PM | 4.4 | 57.1 km | 5,000 m | 8km SSW of Westonaria, South Africa | usgs.gov |
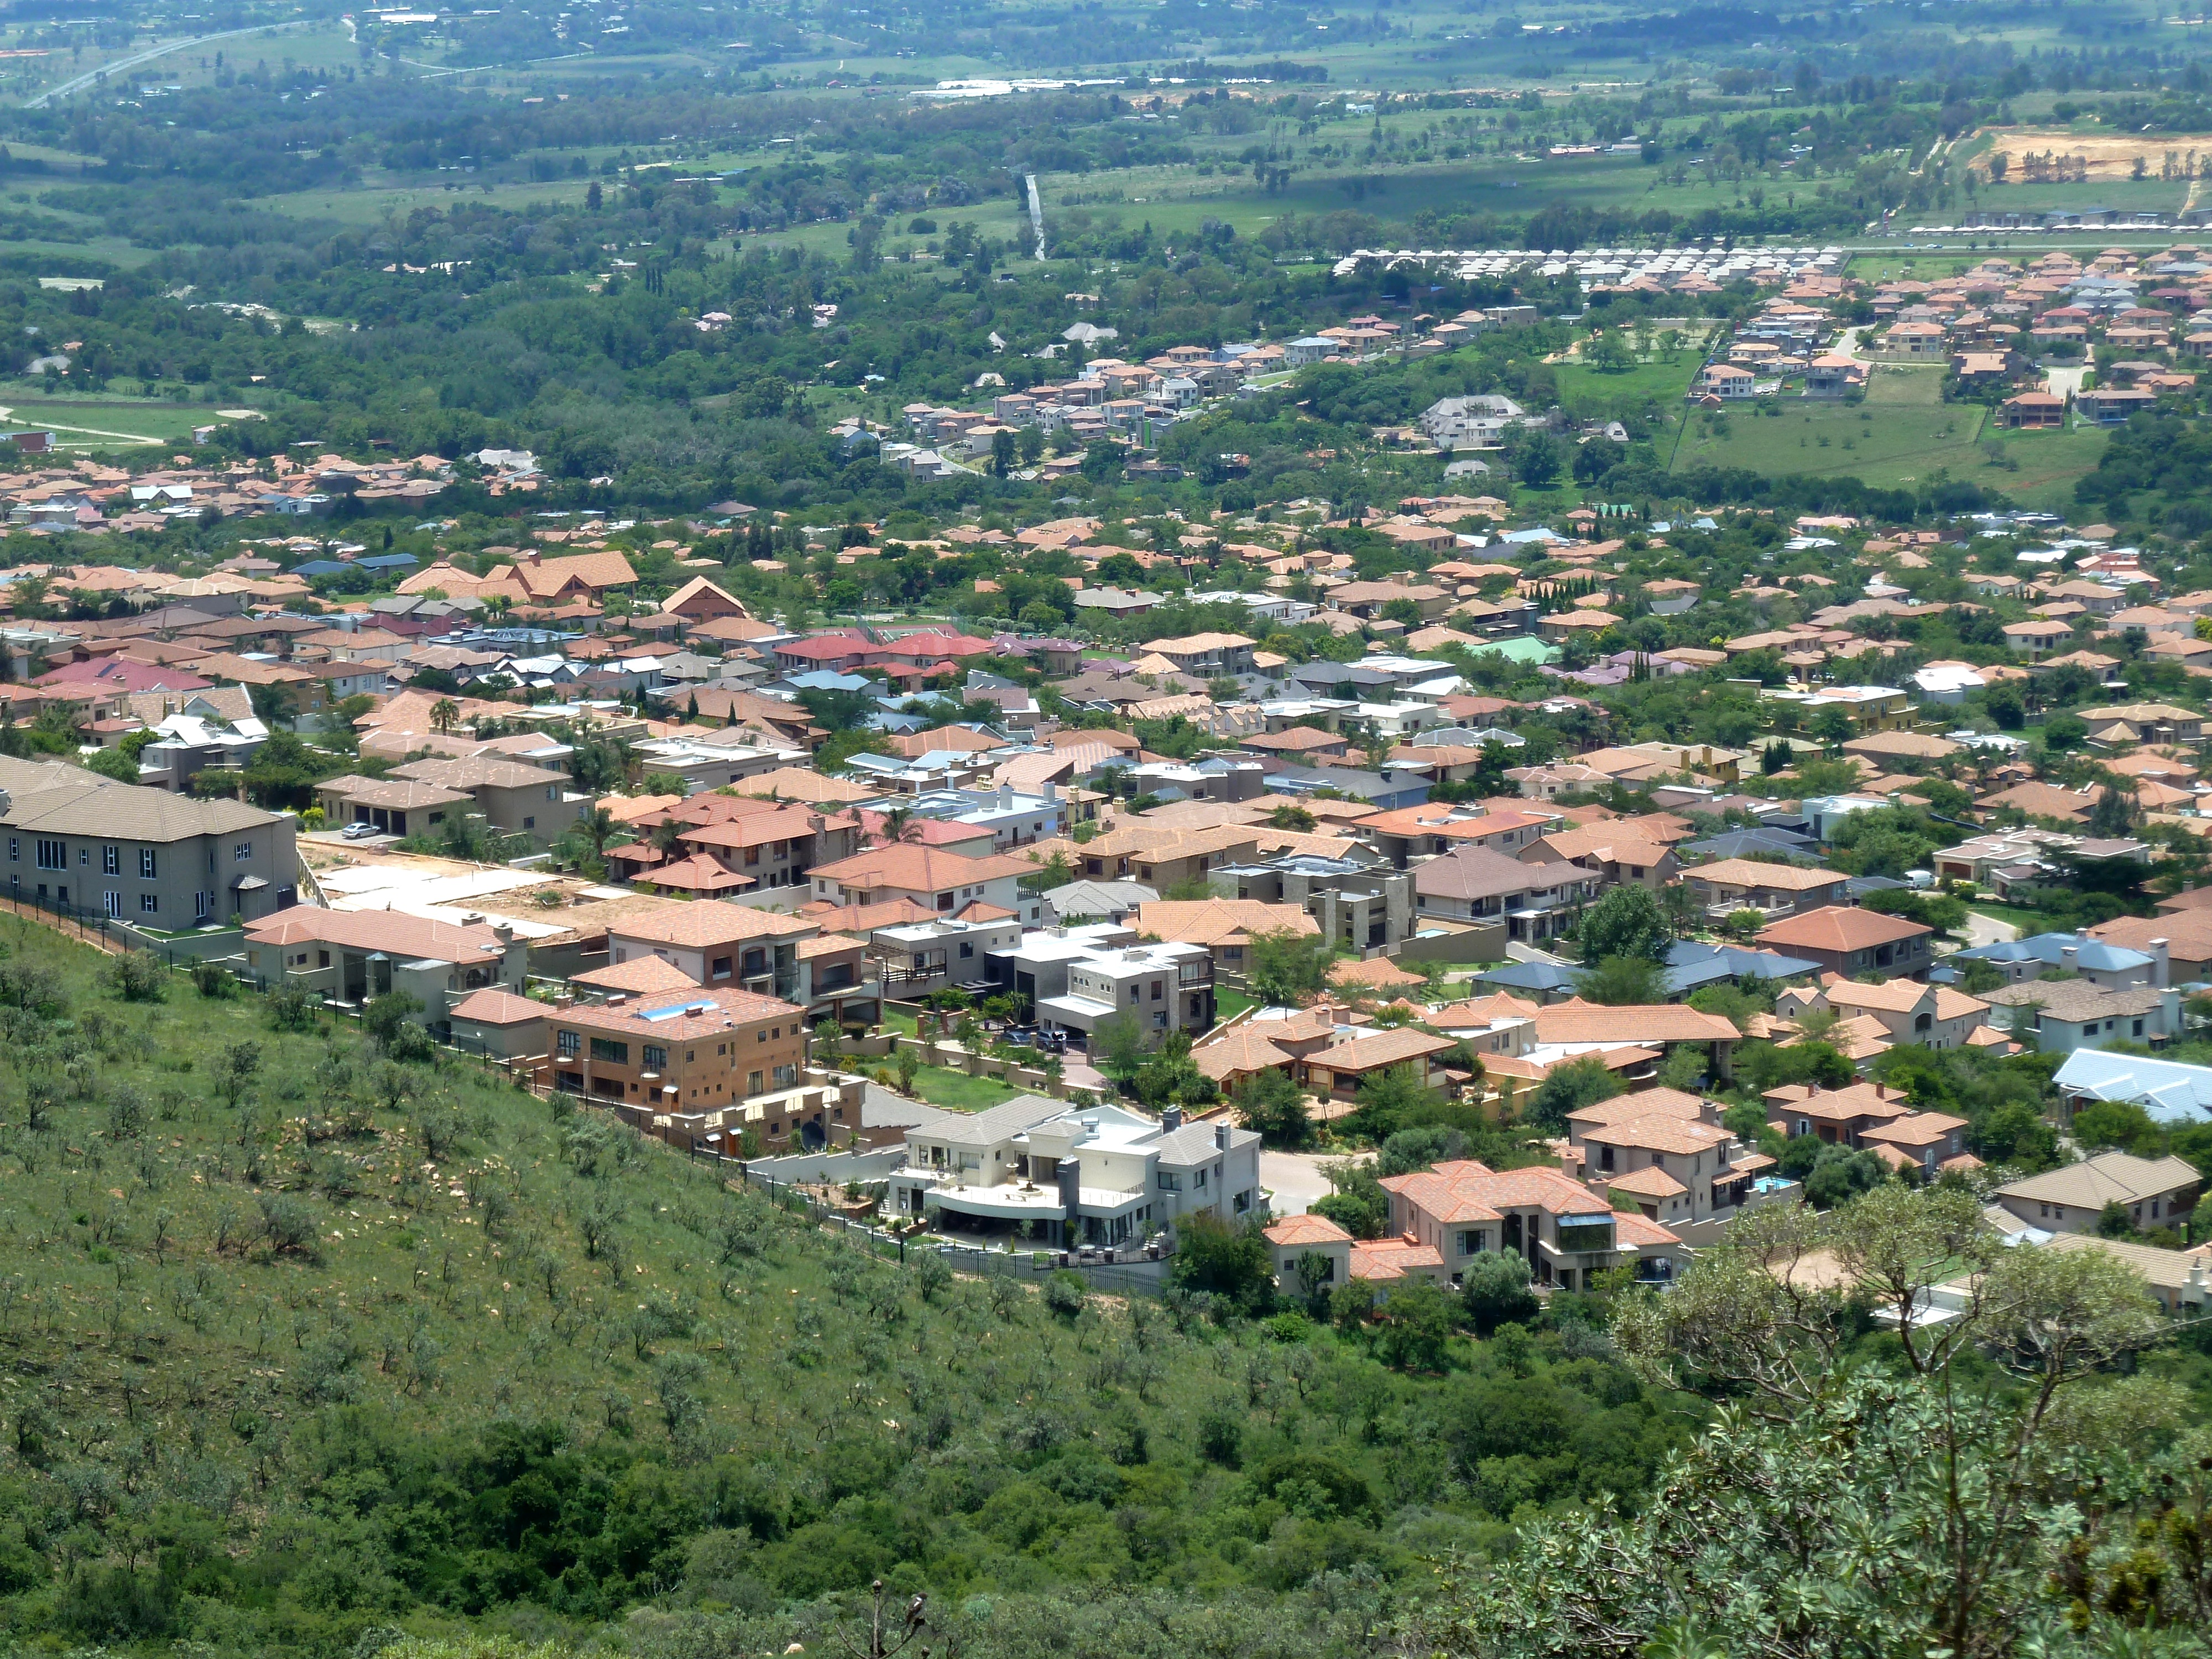
Fourways
The district referred to as Fourways (which is a collection of suburbs, including the traditional suburb of Fourways) is the fastest-developing commercial and residential hub in northern Sandton, north of Johannesburg, South Africa. The main access r..
Fourways Wikipedia Page

About Our Data
The data on this page is estimated using a number of publicly available tools and resources. It is provided without warranty, and could contain inaccuracies. Use at your own risk.