Mohlakeng Facts
| Area | 3.7 km² |
| Population | 41,297 |
| Male Population | 20,921 (50.7%) |
| Female Population | 20,376 (49.3%) |
| Population change (1975 to 2020) | +139.7% |
| Population change (2000 to 2020) | +26.4% |
| Median Age | 28.4 years (Male: 28.3, Female: 28.5) |
| Neighborhoods | Mohlakeng |
| Local Time | |
| Timezone | South Africa Standard Time |
| Lat & Lng | -26.22599, 27.69635 |
Map of Mohlakeng
Interactive Map
Mohlakeng Population
Years 1975 to 2020
| Data | 1975 | 1990 | 2000 | 2015 | 2020 |
|---|---|---|---|---|---|
| Population | 17,231 | 26,728 | 32,676 | 39,110 | 41,297 |
| Population Density | 4,672.8 / km² | 7,248.3 / km² | 8,861.3 / km² | 10,606.1 / km² | 11,199.2 / km² |
Mohlakeng Population change from 2000 to 2015
Increase of 19.7% from year 2000 to 2015
| Location | Change since 1975 | Change since 1990 | Change since 2000 |
|---|---|---|---|
| Mohlakeng | +127% | +46.3% | +19.7% |
| Gauteng | +262.9% | +103.1% | +45.4% |
| South Africa | +111.9% | +48.1% | +21.4% |
Mohlakeng Median Age
Median Age: 28.4 years
| Location | Median Age | Median Age (Female) | Median Age (Male) |
|---|---|---|---|
| Mohlakeng | 28.4 yrs | 28.5 yrs | 28.3 yrs |
| Gauteng | 28.1 yrs | 28.2 yrs | 28.1 yrs |
| South Africa | 25.4 yrs | 26.3 yrs | 24.5 yrs |
Mohlakeng Population Density
Population Density: 11,199 / km²
| Location | Population | Area | Density |
|---|---|---|---|
| Mohlakeng | 41,297 | 3.688 km² | 11,199 / km² |
| Gauteng | 13.5 million | 18,178.3 km² | 744 / km² |
| South Africa | 54.3 million | 1,219,846.5 km² | 44.5 / km² |
Mohlakeng Historical and Projected Population
Estimated Population from 1870 to 2100
- JRC (European Commission's Joint Research Centre) work on the GHS built-up grid
- CIESIN (Center for International Earth Science Information Network)
- [Link] Klein Goldewijk, K., Beusen, A., Doelman, J., and Stehfest, E.: Anthropogenic land use estimates for the Holocene – HYDE 3.2, Earth Syst. Sci. Data, 9, 927–953, https://doi.org/10.5194/essd-9-927-2017, 2017.
Human Development Index (HDI)
Statistic composite index of life expectancy, education, and per capita income.
Mohlakeng CO2 Emissions
Carbon Dioxide (CO2) Emissions Per Capita in Tonnes Per Year
| Location | CO2 Emissions | CO2 Emissions Per Capita | CO2 Emissions Intensity |
|---|---|---|---|
| Mohlakeng | 357,438 tn | 8.66 tn | 96,932.2 tons/km² |
| Gauteng | 126,172,862 tn | 9.33 tn | 6,940.8 tons/km² |
| South Africa | 358,473,408 tn | 6.6 tn | 293.9 tons/km² |
| 2013 CO2 emissions (tonnes/year) | 357,438 tn |
| 2013 CO2 emissions (tonnes/year) per capita | 8.66 tn |
| 2013 CO2 emissions intensity (tonnes/km²/year) | 96,932.2 tons/km² |
Natural Hazards Risk
Relative risk out of 10
| Hazard | Risk Level |
|---|---|
| Drought | Medium (5) |
* Risk, particularly concerning flood or landslide, may not be for the entire area.
- Dilley, M., R.S. Chen, U. Deichmann, A.L. Lerner-Lam, M. Arnold, J. Agwe, P. Buys, O. Kjekstad, B. Lyon, and G. Yetman. 2005. Natural Disaster Hotspots: A Global Risk Analysis. Washington, D.C.: World Bank. https://doi.org/10.1596/0-8213-5930-4.
- Center for Hazards and Risk Research - CHRR - Columbia University, Center for International Earth Science Information Network - CIESIN - Columbia University, and International Research Institute for Climate and Society - IRI - Columbia University. 2005. Global Drought Hazard Frequency and Distribution. Palisades, NY: NASA Socioeconomic Data and Applications Center (SEDAC). https://doi.org/10.7927/H4VX0DFT.
Recent Nearby Earthquakes
Magnitude 3.0 and greater
| Date▼ | Time↕ | Magnitude↕ | Distance↕ | Depth↕ | Location↕ | Link |
|---|---|---|---|---|---|---|
| 3/1/19 | 4:56 AM | 4.9 | 11.8 km | 5,000 m | 6km WSW of Soweto, South Africa | usgs.gov |
| 6/29/18 | 1:17 AM | 4.5 | 24.5 km | 5,000 m | 13km SSW of Westonaria, South Africa | usgs.gov |
| 6/28/18 | 4:10 PM | 4.3 | 29.4 km | 5,000 m | 16km E of Fochville, South Africa | usgs.gov |
| 3/17/18 | 7:42 PM | 4 | 22.9 km | 5,000 m | 11km SW of Westonaria, South Africa | usgs.gov |
| 3/14/18 | 3:55 PM | 4.5 | 24.5 km | 5,000 m | 10km NNE of Fochville, South Africa | usgs.gov |
| 2/20/18 | 5:23 PM | 4.5 | 17.1 km | 5,000 m | 7km SSW of Soweto, South Africa | usgs.gov |
| 2/17/18 | 5:16 AM | 4.2 | 26.1 km | 5,000 m | 8km WNW of Orange Farm, South Africa | usgs.gov |
| 1/23/18 | 7:47 PM | 4.4 | 13.4 km | 5,000 m | 4km WSW of Soweto, South Africa | usgs.gov |
| 7/25/17 | 4:18 AM | 4.4 | 27.3 km | 5,000 m | 14km E of Fochville, South Africa | usgs.gov |
| 2/7/17 | 2:02 PM | 4.4 | 14.5 km | 5,000 m | 7km WNW of Westonaria, South Africa | usgs.gov |
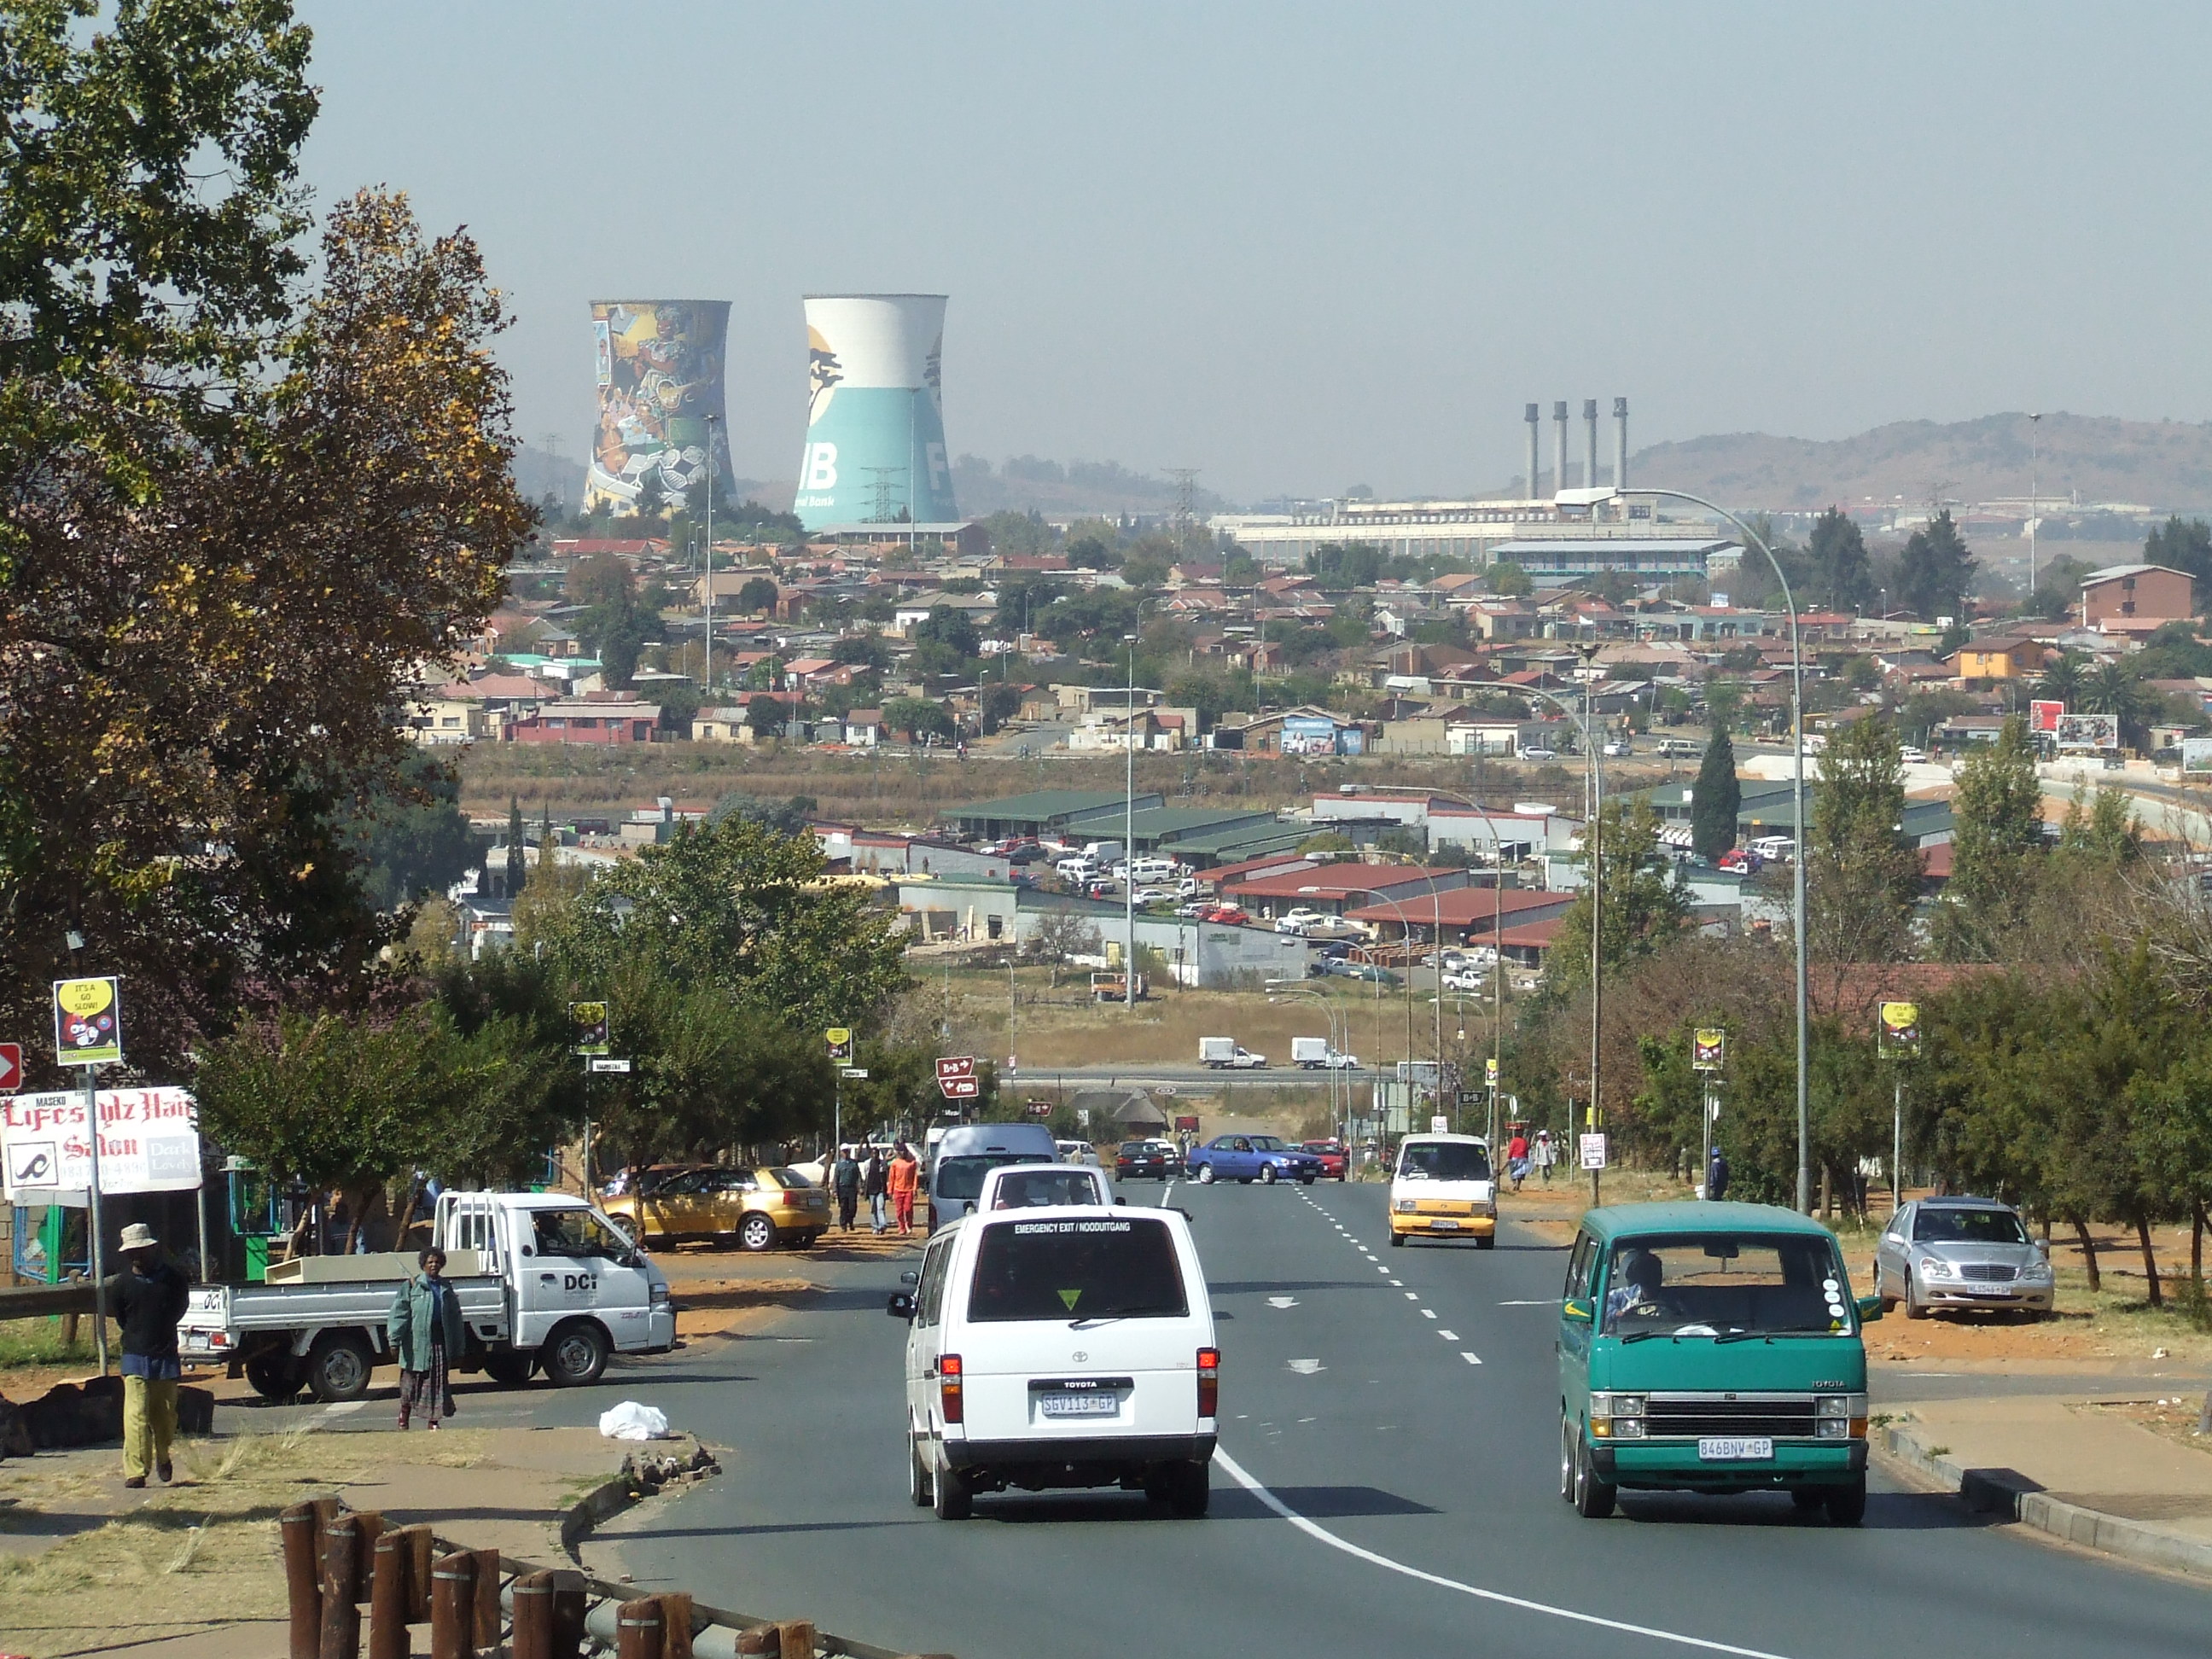
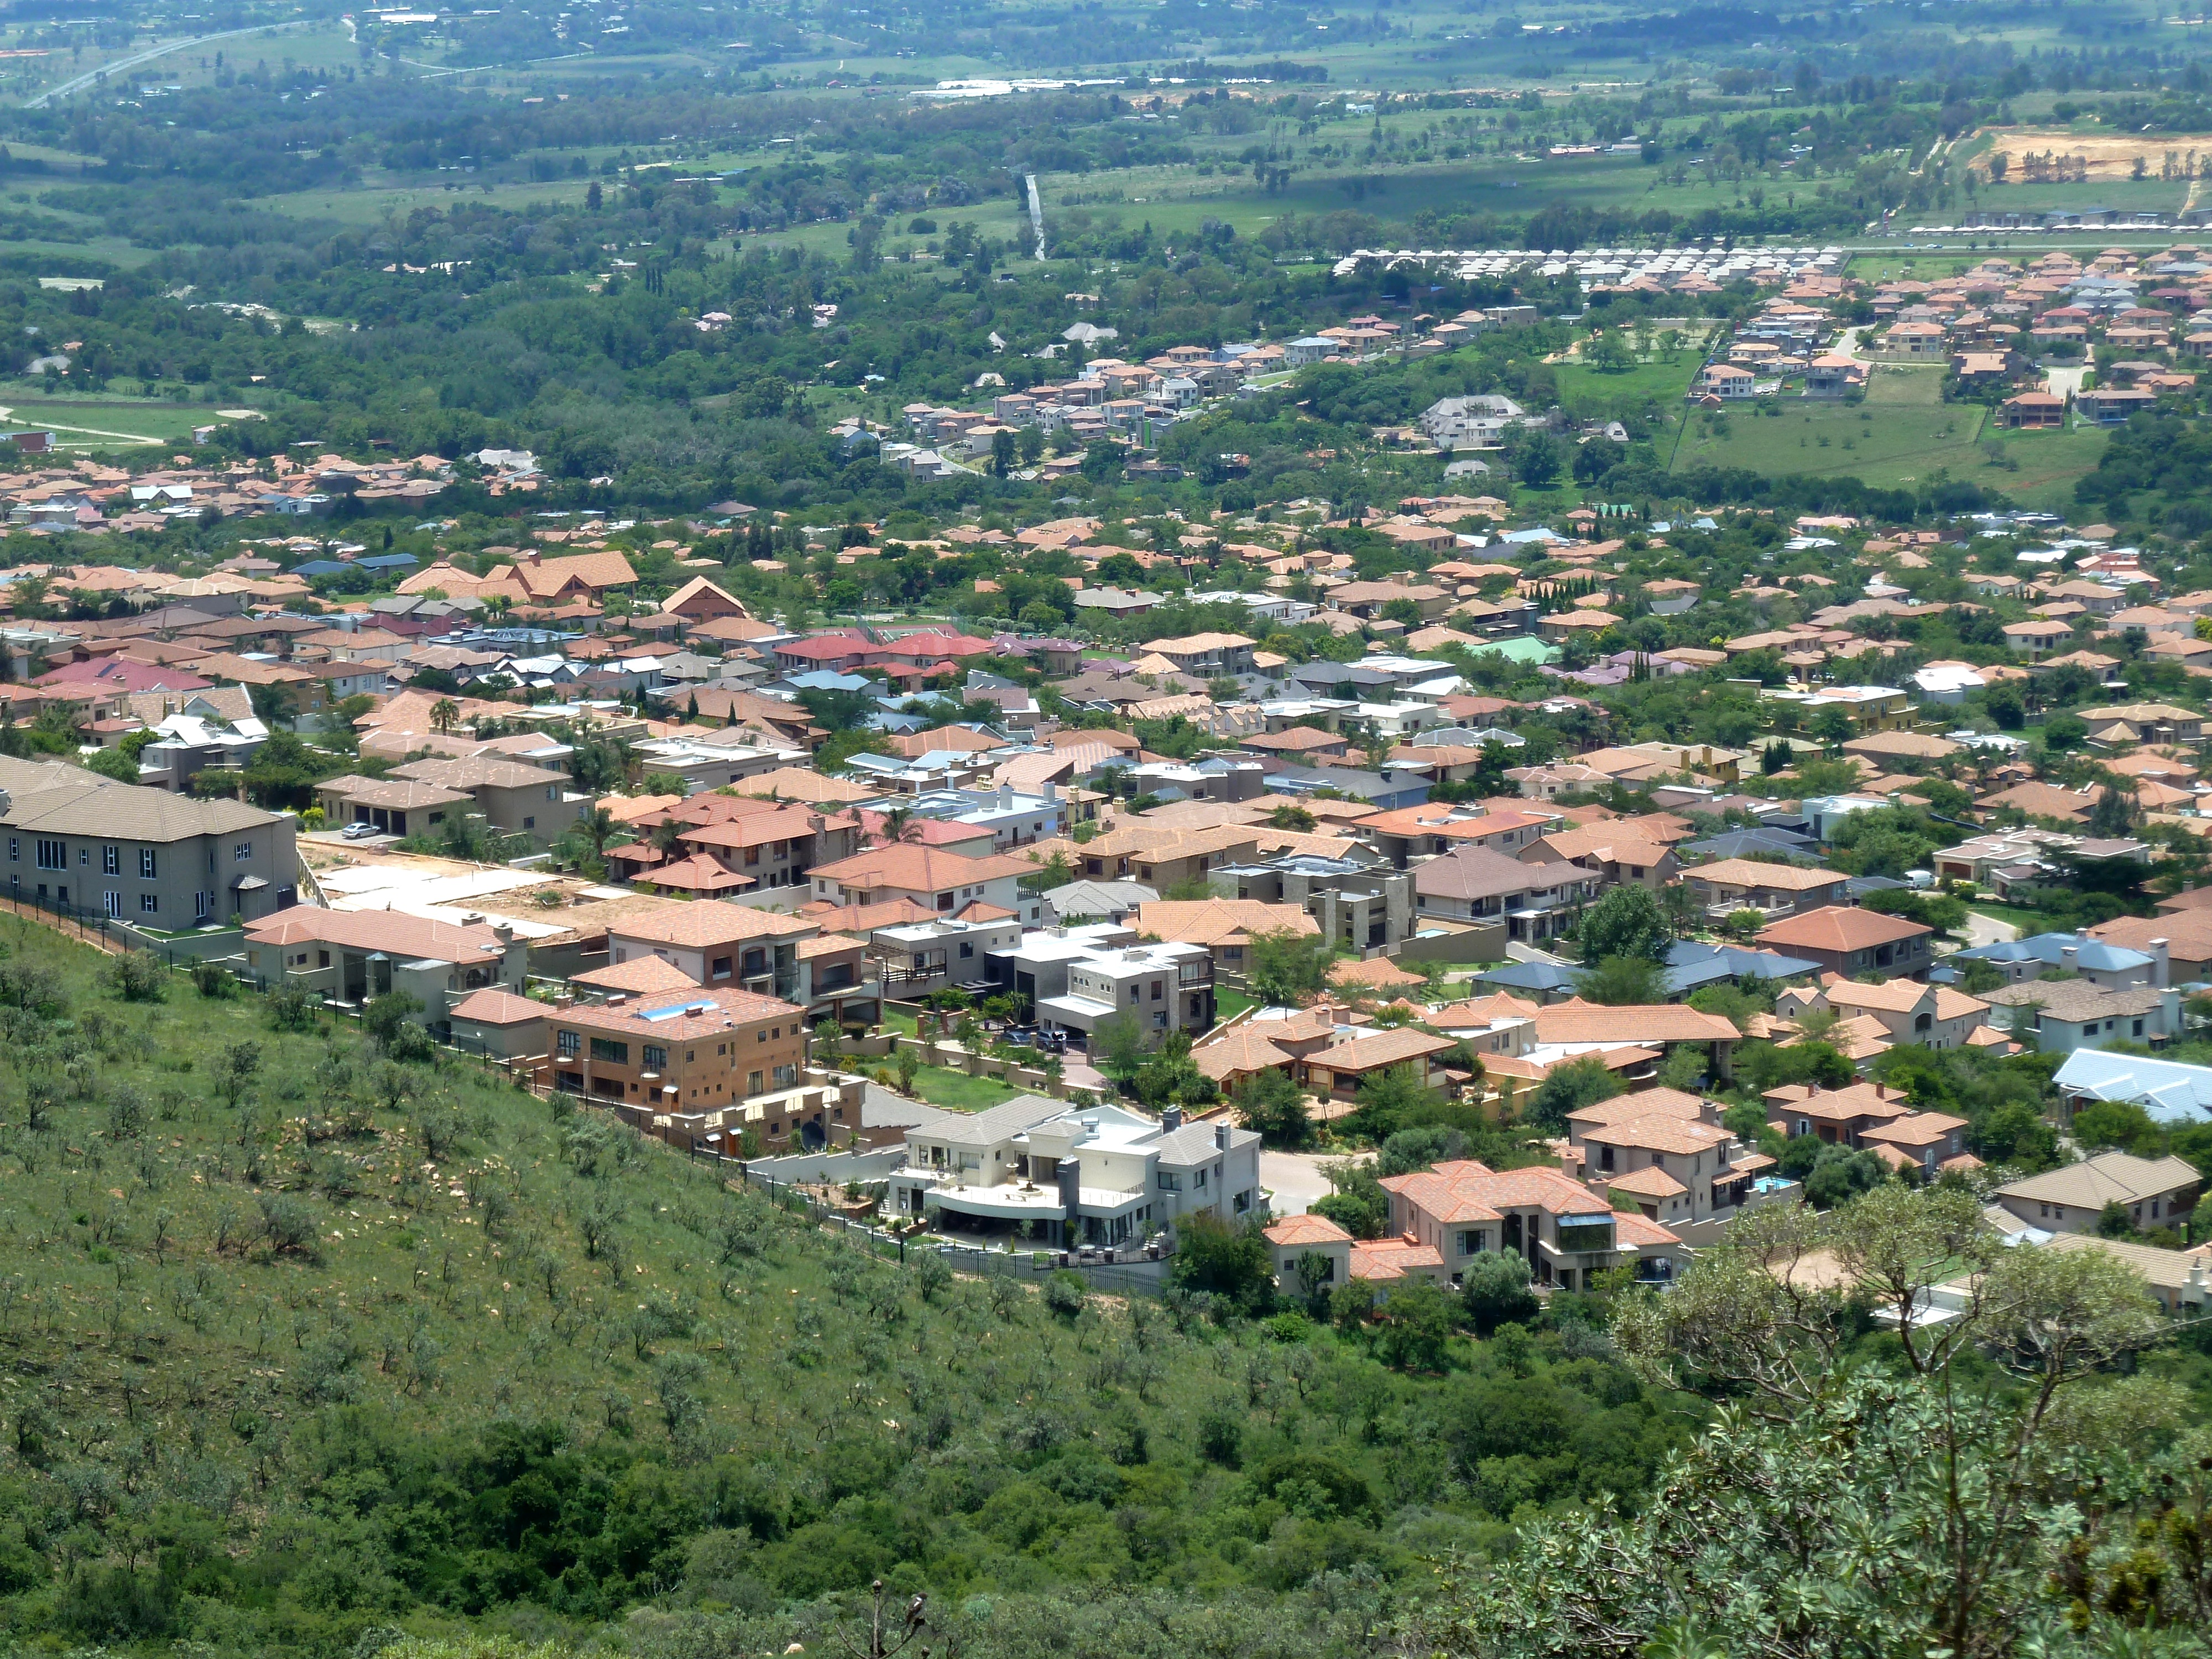
Mohlakeng
Mohlakeng is a township south of Randfontein in Gauteng, South Africa. A local authority was established in 1984. Mohlakeng is where the large part of the Randfontein population is situated. It lies 7 kilometres south of Randfontein, and around 38 ki..
Mohlakeng Wikipedia Page
About Our Data
The data on this page is estimated using a number of publicly available tools and resources. It is provided without warranty, and could contain inaccuracies. Use at your own risk.