Categories in Parktown
Parktown Facts
| Area | 13.0 km² |
| Population | 53,460 |
| Male Population | 26,398 (49.4%) |
| Female Population | 27,062 (50.6%) |
| Population change (1975 to 2020) | +382.3% |
| Population change (2000 to 2020) | +65.3% |
| Median Age | 28.2 years (Male: 27.7, Female: 28.7) |
| Neighborhoods | Parktown, Parktown North, Darrenwood, Braamfontein, Dunkeld West |
| Local Time | |
| Timezone | South Africa Standard Time |
| Lat & Lng | -26.18205, 28.02671 |
Map of Parktown
Interactive Map
Parktown Population
Years 1975 to 2020
| Data | 1975 | 1990 | 2000 | 2015 | 2020 |
|---|---|---|---|---|---|
| Population | 11,084 | 21,917 | 32,345 | 50,624 | 53,460 |
| Population Density | 852.6 / km² | 1,685.9 / km² | 2,488.1 / km² | 3,894.2 / km² | 4,112.3 / km² |
Parktown Population change from 2000 to 2015
Increase of 56.5% from year 2000 to 2015
| Location | Change since 1975 | Change since 1990 | Change since 2000 |
|---|---|---|---|
| Parktown | +356.7% | +131% | +56.5% |
| Gauteng | +262.9% | +103.1% | +45.4% |
| South Africa | +111.9% | +48.1% | +21.4% |
Parktown Median Age
Median Age: 28.2 years
| Location | Median Age | Median Age (Female) | Median Age (Male) |
|---|---|---|---|
| Parktown | 28.2 yrs | 28.7 yrs | 27.7 yrs |
| Gauteng | 28.1 yrs | 28.2 yrs | 28.1 yrs |
| South Africa | 25.4 yrs | 26.3 yrs | 24.5 yrs |
Parktown Population Density
Population Density: 4,112 / km²
| Location | Population | Area | Density |
|---|---|---|---|
| Parktown | 53,460 | 13 km² | 4,112 / km² |
| Gauteng | 13.5 million | 18,178.3 km² | 744 / km² |
| South Africa | 54.3 million | 1,219,846.5 km² | 44.5 / km² |
Parktown Historical and Projected Population
Estimated Population from 1900 to 2100
- JRC (European Commission's Joint Research Centre) work on the GHS built-up grid
- CIESIN (Center for International Earth Science Information Network)
- [Link] Klein Goldewijk, K., Beusen, A., Doelman, J., and Stehfest, E.: Anthropogenic land use estimates for the Holocene – HYDE 3.2, Earth Syst. Sci. Data, 9, 927–953, https://doi.org/10.5194/essd-9-927-2017, 2017.
Neighborhoods in Parktown
Percentage of businesses by neighborhood in Parktown
Price Distribution
Business distribution by price for Parktown
Human Development Index (HDI)
Statistic composite index of life expectancy, education, and per capita income.
Parktown CO2 Emissions
Carbon Dioxide (CO2) Emissions Per Capita in Tonnes Per Year
| Location | CO2 Emissions | CO2 Emissions Per Capita | CO2 Emissions Intensity |
|---|---|---|---|
| Parktown | 561,809 tn | 10.51 tn | 43,216.1 tons/km² |
| Gauteng | 126,172,862 tn | 9.33 tn | 6,940.8 tons/km² |
| South Africa | 358,473,408 tn | 6.6 tn | 293.9 tons/km² |
| 2013 CO2 emissions (tonnes/year) | 561,809 tn |
| 2013 CO2 emissions (tonnes/year) per capita | 10.51 tn |
| 2013 CO2 emissions intensity (tonnes/km²/year) | 43,216.1 tons/km² |
Natural Hazards Risk
Relative risk out of 10
| Hazard | Risk Level |
|---|---|
| Drought | Medium (5) |
* Risk, particularly concerning flood or landslide, may not be for the entire area.
- Dilley, M., R.S. Chen, U. Deichmann, A.L. Lerner-Lam, M. Arnold, J. Agwe, P. Buys, O. Kjekstad, B. Lyon, and G. Yetman. 2005. Natural Disaster Hotspots: A Global Risk Analysis. Washington, D.C.: World Bank. https://doi.org/10.1596/0-8213-5930-4.
- Center for Hazards and Risk Research - CHRR - Columbia University, Center for International Earth Science Information Network - CIESIN - Columbia University, and International Research Institute for Climate and Society - IRI - Columbia University. 2005. Global Drought Hazard Frequency and Distribution. Palisades, NY: NASA Socioeconomic Data and Applications Center (SEDAC). https://doi.org/10.7927/H4VX0DFT.
Recent Nearby Earthquakes
Magnitude 3.0 and greater
| Date▼ | Time↕ | Magnitude↕ | Distance↕ | Depth↕ | Location↕ | Link |
|---|---|---|---|---|---|---|
| 3/1/19 | 4:56 AM | 4.9 | 25.2 km | 5,000 m | 6km WSW of Soweto, South Africa | usgs.gov |
| 6/29/18 | 1:17 AM | 4.5 | 49.4 km | 5,000 m | 13km SSW of Westonaria, South Africa | usgs.gov |
| 6/28/18 | 4:10 PM | 4.3 | 50.4 km | 5,000 m | 16km E of Fochville, South Africa | usgs.gov |
| 3/17/18 | 7:42 PM | 4 | 51.8 km | 5,000 m | 11km SW of Westonaria, South Africa | usgs.gov |
| 3/14/18 | 3:55 PM | 4.5 | 53.6 km | 5,000 m | 10km NNE of Fochville, South Africa | usgs.gov |
| 2/20/18 | 5:23 PM | 4.5 | 26.2 km | 5,000 m | 7km SSW of Soweto, South Africa | usgs.gov |
| 2/17/18 | 5:16 AM | 4.2 | 37.4 km | 5,000 m | 8km WNW of Orange Farm, South Africa | usgs.gov |
| 1/23/18 | 7:47 PM | 4.4 | 23.6 km | 5,000 m | 4km WSW of Soweto, South Africa | usgs.gov |
| 7/25/17 | 4:18 AM | 4.4 | 50.3 km | 5,000 m | 14km E of Fochville, South Africa | usgs.gov |
| 2/7/17 | 2:02 PM | 4.4 | 46.7 km | 5,000 m | 7km WNW of Westonaria, South Africa | usgs.gov |
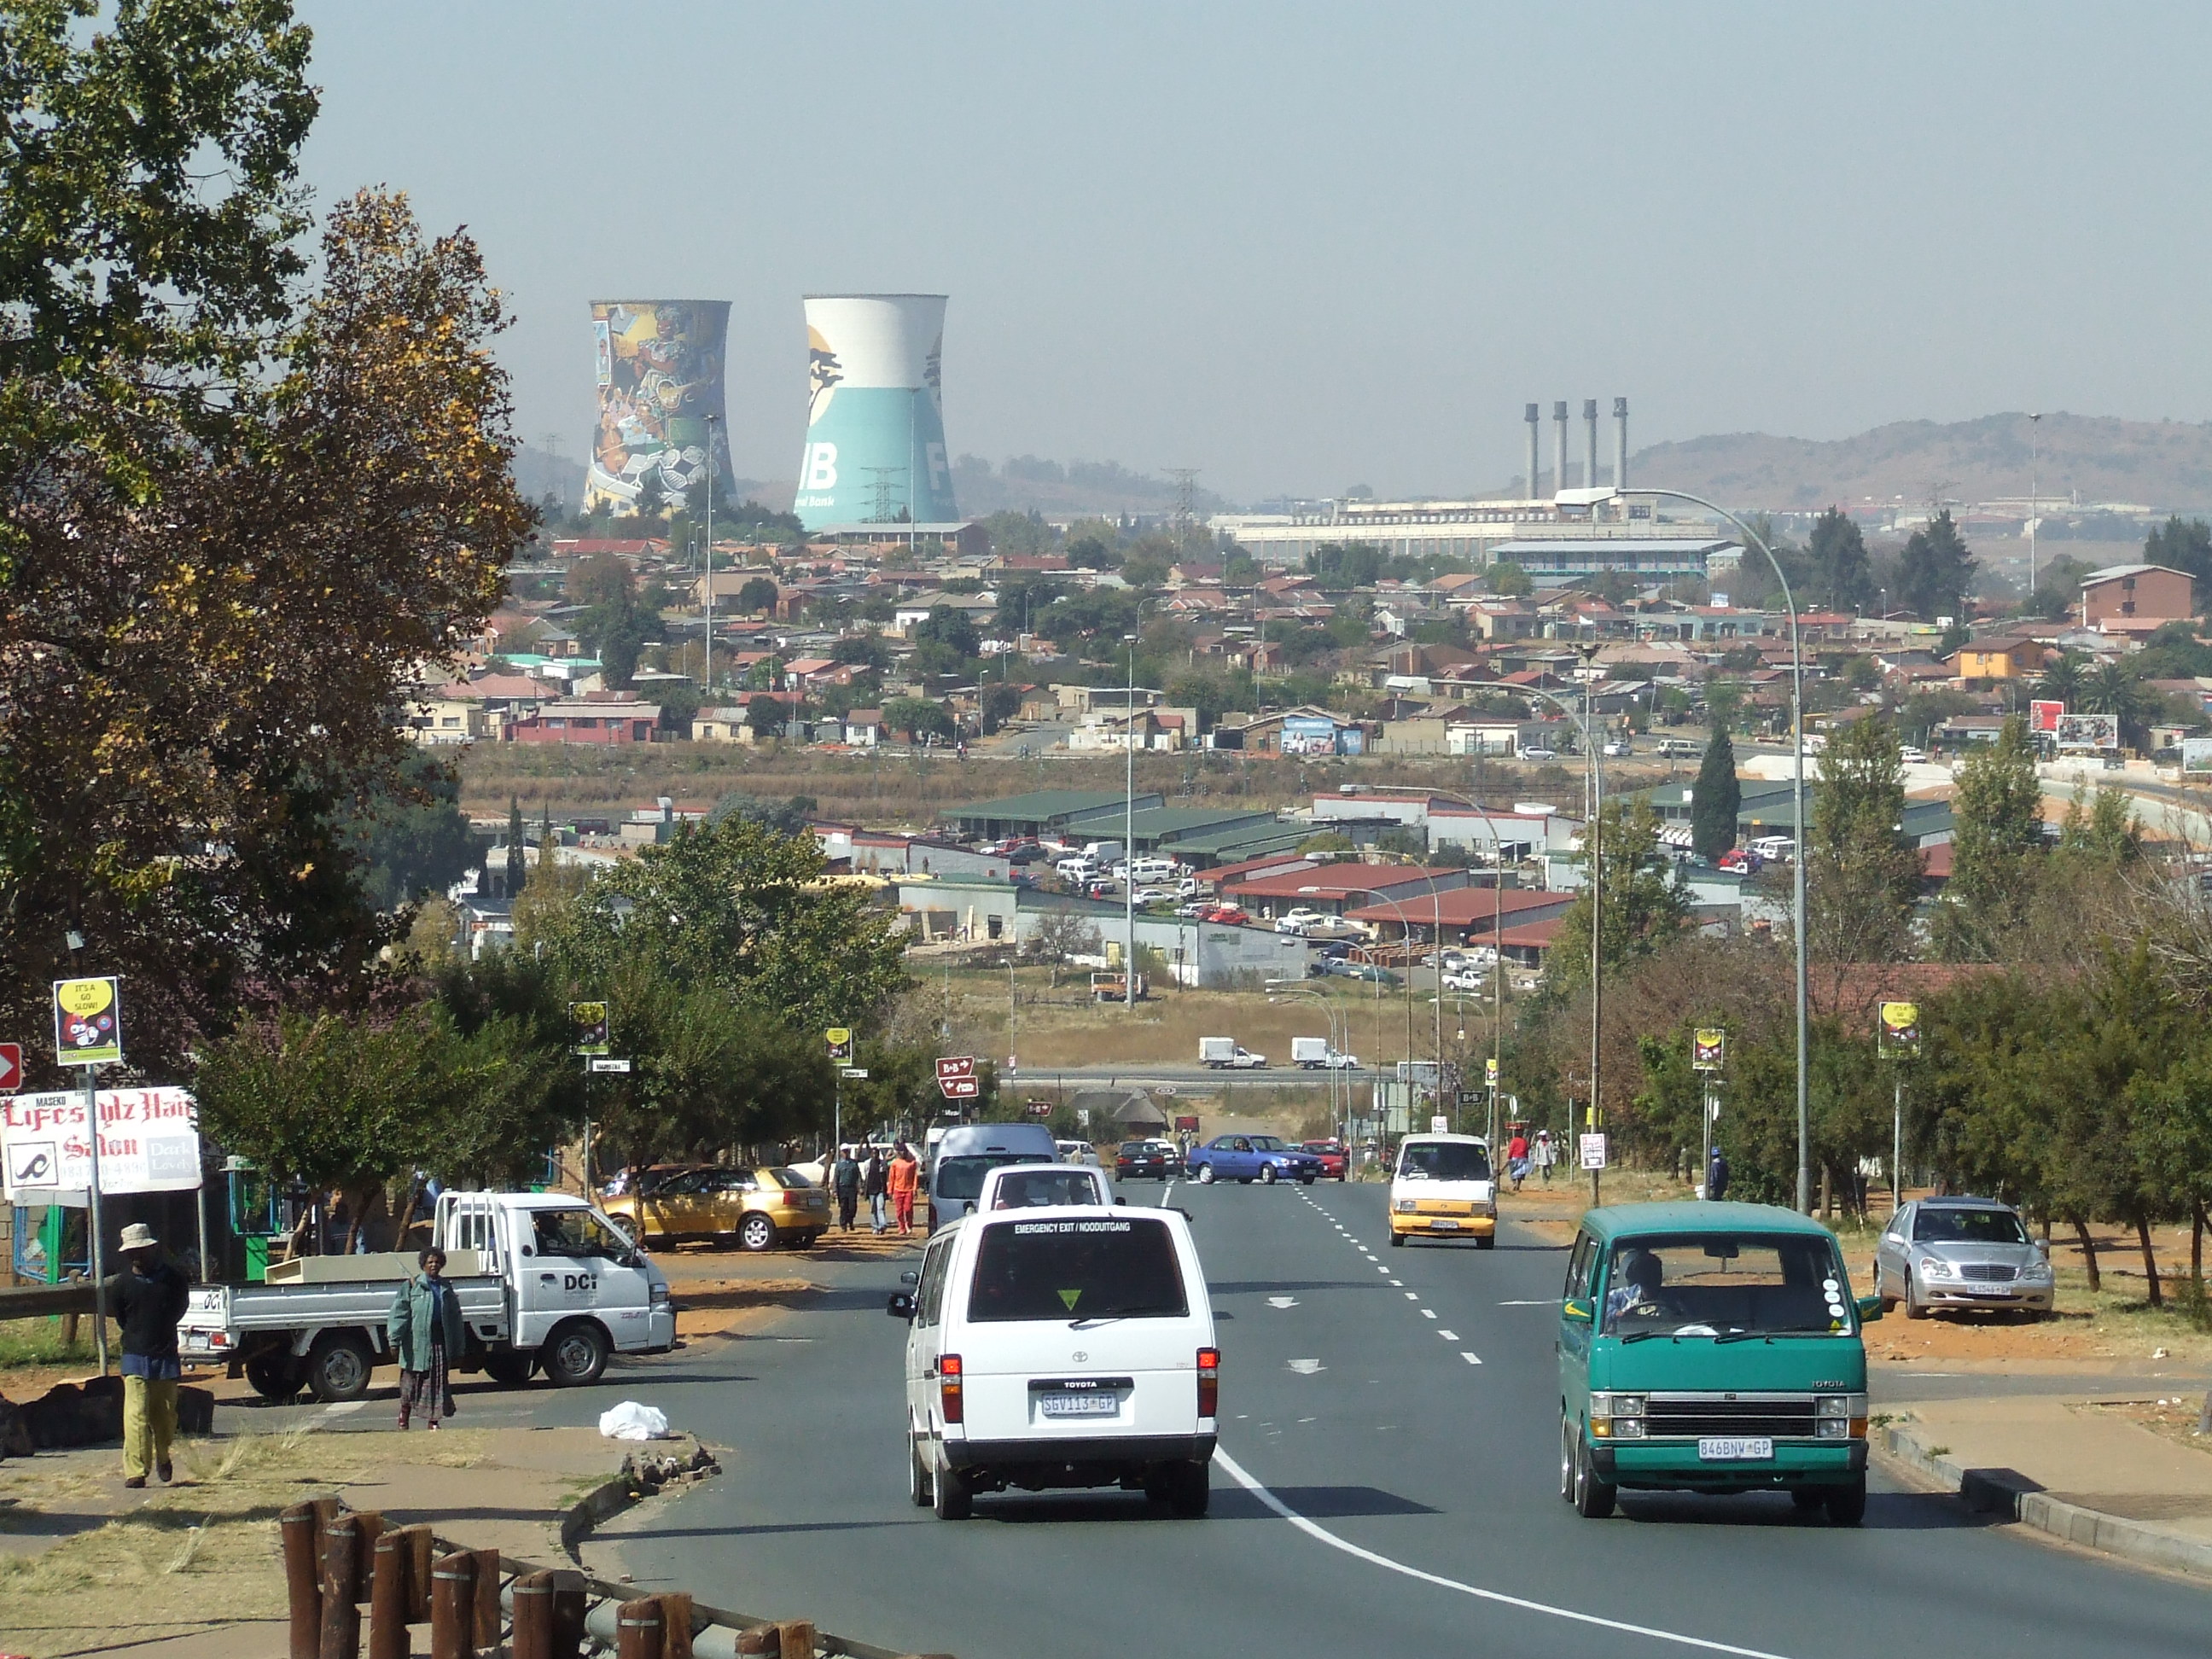
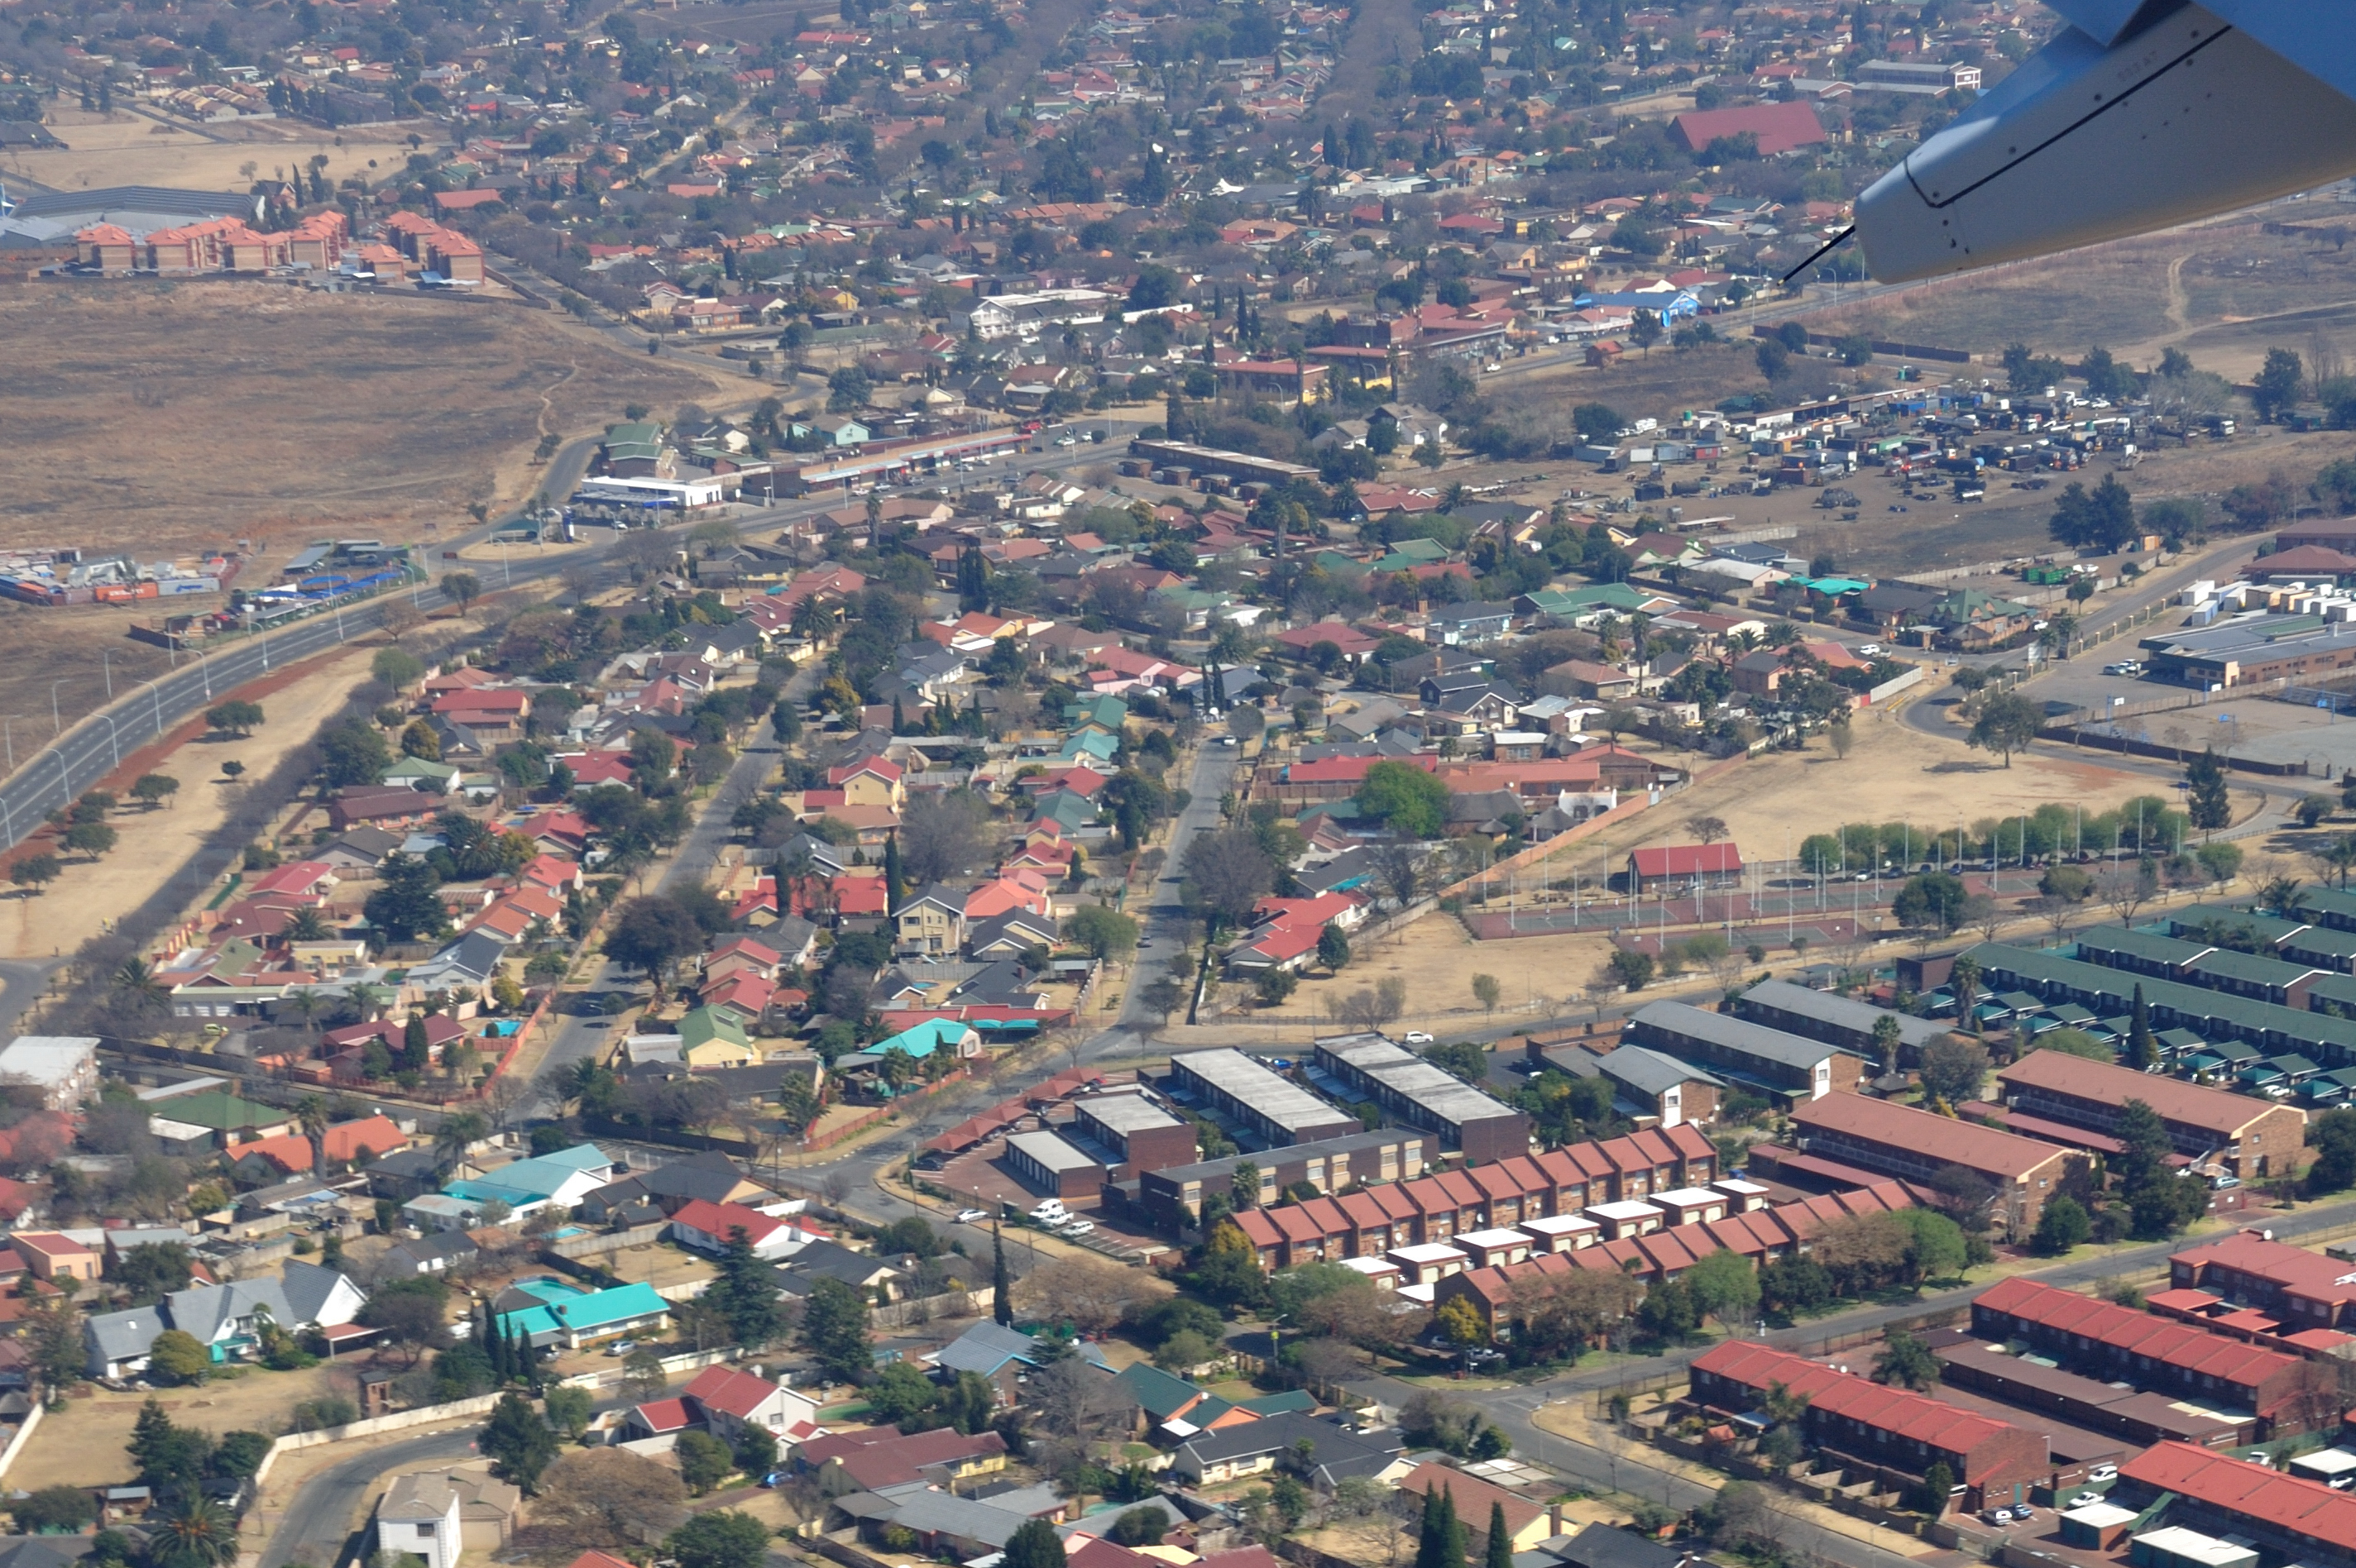
Parktown
Parktown is a suburb of Johannesburg, South Africa, the first suburb north of the inner-city. It is affectionately known as one of the Parks, others including Parkview, Parkwood, Westcliff, Parktown North, Parkhurst and Forest Town. Parktown is one o..
Parktown Wikipedia Page

About Our Data
The data on this page is estimated using a number of publicly available tools and resources. It is provided without warranty, and could contain inaccuracies. Use at your own risk.