Categories in Vereeniging
Industries
Business Distribution by Industry in Vereeniging
| Industry Description | Number of Establishments | Average Age of Business |
|---|---|---|
| Shopping | 475 | 24 years |
| Car repair | 298 | 34 years |
| Restaurants | 278 | 30 years |
| Corporate management | 239 | 25 years |
| Clothing stores | 206 | — |
| Wholesale of machinery | 173 | 37 years |
| Grocery stores and supermarkets | 169 | — |
| Health and medical | 150 | — |
| Electronics stores | 147 | — |
| Education | 138 | 26 years |
| Other accommodation | 136 | 19 years |
Vereeniging Facts
| Area | 1.7 km² |
| Population | 2,381 |
| Male Population | 1,142 (47.9%) |
| Female Population | 1,239 (52.1%) |
| Population change (1975 to 2020) | +99.4% |
| Population change (2000 to 2020) | +17.1% |
| Median Age | 36.5 years (Male: 34.8, Female: 37.9) |
| Area Codes | 16 |
| Neighborhoods | Three Rivers, Duncanville, Meyerton, Powerville, Arcon Park |
| Local Time | |
| Timezone | South Africa Standard Time |
| Lat & Lng | -26.67313, 27.92615 |
| Postal Codes | 1905, 1918, 1929, 1933, 1934, More |
Map of Vereeniging
Interactive Map
Vereeniging Population
Years 1975 to 2020
| Data | 1975 | 1990 | 2000 | 2015 | 2020 |
|---|---|---|---|---|---|
| Population | 1,194 | 1,693 | 2,034 | 2,257 | 2,381 |
| Population Density | 707.6 / km² | 1,003.3 / km² | 1,205.3 / km² | 1,337.5 / km² | 1,411 / km² |
Vereeniging Population change from 2000 to 2015
Increase of 11% from year 2000 to 2015
| Location | Change since 1975 | Change since 1990 | Change since 2000 |
|---|---|---|---|
| Vereeniging | +89% | +33.3% | +11% |
| Gauteng | +262.9% | +103.1% | +45.4% |
| South Africa | +111.9% | +48.1% | +21.4% |
Vereeniging Median Age
Median Age: 36.5 years
| Location | Median Age | Median Age (Female) | Median Age (Male) |
|---|---|---|---|
| Vereeniging | 36.5 yrs | 37.9 yrs | 34.8 yrs |
| Gauteng | 28.1 yrs | 28.2 yrs | 28.1 yrs |
| South Africa | 25.4 yrs | 26.3 yrs | 24.5 yrs |
Vereeniging Population Density
Population Density: 1,411 / km²
| Location | Population | Area | Density |
|---|---|---|---|
| Vereeniging | 2,381 | 1.688 km² | 1,411 / km² |
| Gauteng | 13.5 million | 18,178.3 km² | 744 / km² |
| South Africa | 54.3 million | 1,219,846.5 km² | 44.5 / km² |
Vereeniging Historical and Projected Population
Estimated Population from 1720 to 2100
- JRC (European Commission's Joint Research Centre) work on the GHS built-up grid
- CIESIN (Center for International Earth Science Information Network)
- [Link] Klein Goldewijk, K., Beusen, A., Doelman, J., and Stehfest, E.: Anthropogenic land use estimates for the Holocene – HYDE 3.2, Earth Syst. Sci. Data, 9, 927–953, https://doi.org/10.5194/essd-9-927-2017, 2017.
Neighborhoods in Vereeniging
Percentage of businesses by neighborhood in Vereeniging
Area Codes
Percentage Area Codes used by businesses in Vereeniging
Postal Codes
Percentage of businesses by Postal Codes in Vereeniging
Price Distribution
Business distribution by price for Vereeniging
Human Development Index (HDI)
Statistic composite index of life expectancy, education, and per capita income.
Vereeniging CO2 Emissions
Carbon Dioxide (CO2) Emissions Per Capita in Tonnes Per Year
| Location | CO2 Emissions | CO2 Emissions Per Capita | CO2 Emissions Intensity |
|---|---|---|---|
| Vereeniging | 19,772 tn | 8.3 tn | 11,716.9 tons/km² |
| Gauteng | 126,172,862 tn | 9.33 tn | 6,940.8 tons/km² |
| South Africa | 358,473,408 tn | 6.6 tn | 293.9 tons/km² |
| 2013 CO2 emissions (tonnes/year) | 19,772 tn |
| 2013 CO2 emissions (tonnes/year) per capita | 8.3 tn |
| 2013 CO2 emissions intensity (tonnes/km²/year) | 11,716.9 tons/km² |
Natural Hazards Risk
Relative risk out of 10
| Hazard | Risk Level |
|---|---|
| Drought | Medium (5) |
* Risk, particularly concerning flood or landslide, may not be for the entire area.
- Dilley, M., R.S. Chen, U. Deichmann, A.L. Lerner-Lam, M. Arnold, J. Agwe, P. Buys, O. Kjekstad, B. Lyon, and G. Yetman. 2005. Natural Disaster Hotspots: A Global Risk Analysis. Washington, D.C.: World Bank. https://doi.org/10.1596/0-8213-5930-4.
- Center for Hazards and Risk Research - CHRR - Columbia University, Center for International Earth Science Information Network - CIESIN - Columbia University, and International Research Institute for Climate and Society - IRI - Columbia University. 2005. Global Drought Hazard Frequency and Distribution. Palisades, NY: NASA Socioeconomic Data and Applications Center (SEDAC). https://doi.org/10.7927/H4VX0DFT.
Recent Nearby Earthquakes
Magnitude 3.0 and greater
| Date▼ | Time↕ | Magnitude↕ | Distance↕ | Depth↕ | Location↕ | Link |
|---|---|---|---|---|---|---|
| 3/7/19 | 9:32 AM | 4.8 | 42.4 km | 5,000 m | 6km E of Fochville, South Africa | usgs.gov |
| 3/1/19 | 4:56 AM | 4.9 | 45.5 km | 5,000 m | 6km WSW of Soweto, South Africa | usgs.gov |
| 6/29/18 | 1:17 AM | 4.5 | 40.3 km | 5,000 m | 13km SSW of Westonaria, South Africa | usgs.gov |
| 6/28/18 | 4:10 PM | 4.3 | 33.9 km | 5,000 m | 16km E of Fochville, South Africa | usgs.gov |
| 5/4/18 | 12:08 PM | 4.4 | 50.1 km | 5,000 m | 7km N of Fochville, South Africa | usgs.gov |
| 3/28/18 | 6:22 AM | 4.6 | 41.2 km | 5,000 m | 6km E of Fochville, South Africa | usgs.gov |
| 3/17/18 | 7:42 PM | 4 | 47.4 km | 5,000 m | 11km SW of Westonaria, South Africa | usgs.gov |
| 3/14/18 | 3:55 PM | 4.5 | 48 km | 5,000 m | 10km NNE of Fochville, South Africa | usgs.gov |
| 2/20/18 | 5:23 PM | 4.5 | 39.3 km | 5,000 m | 7km SSW of Soweto, South Africa | usgs.gov |
| 2/17/18 | 5:16 AM | 4.2 | 28.6 km | 5,000 m | 8km WNW of Orange Farm, South Africa | usgs.gov |
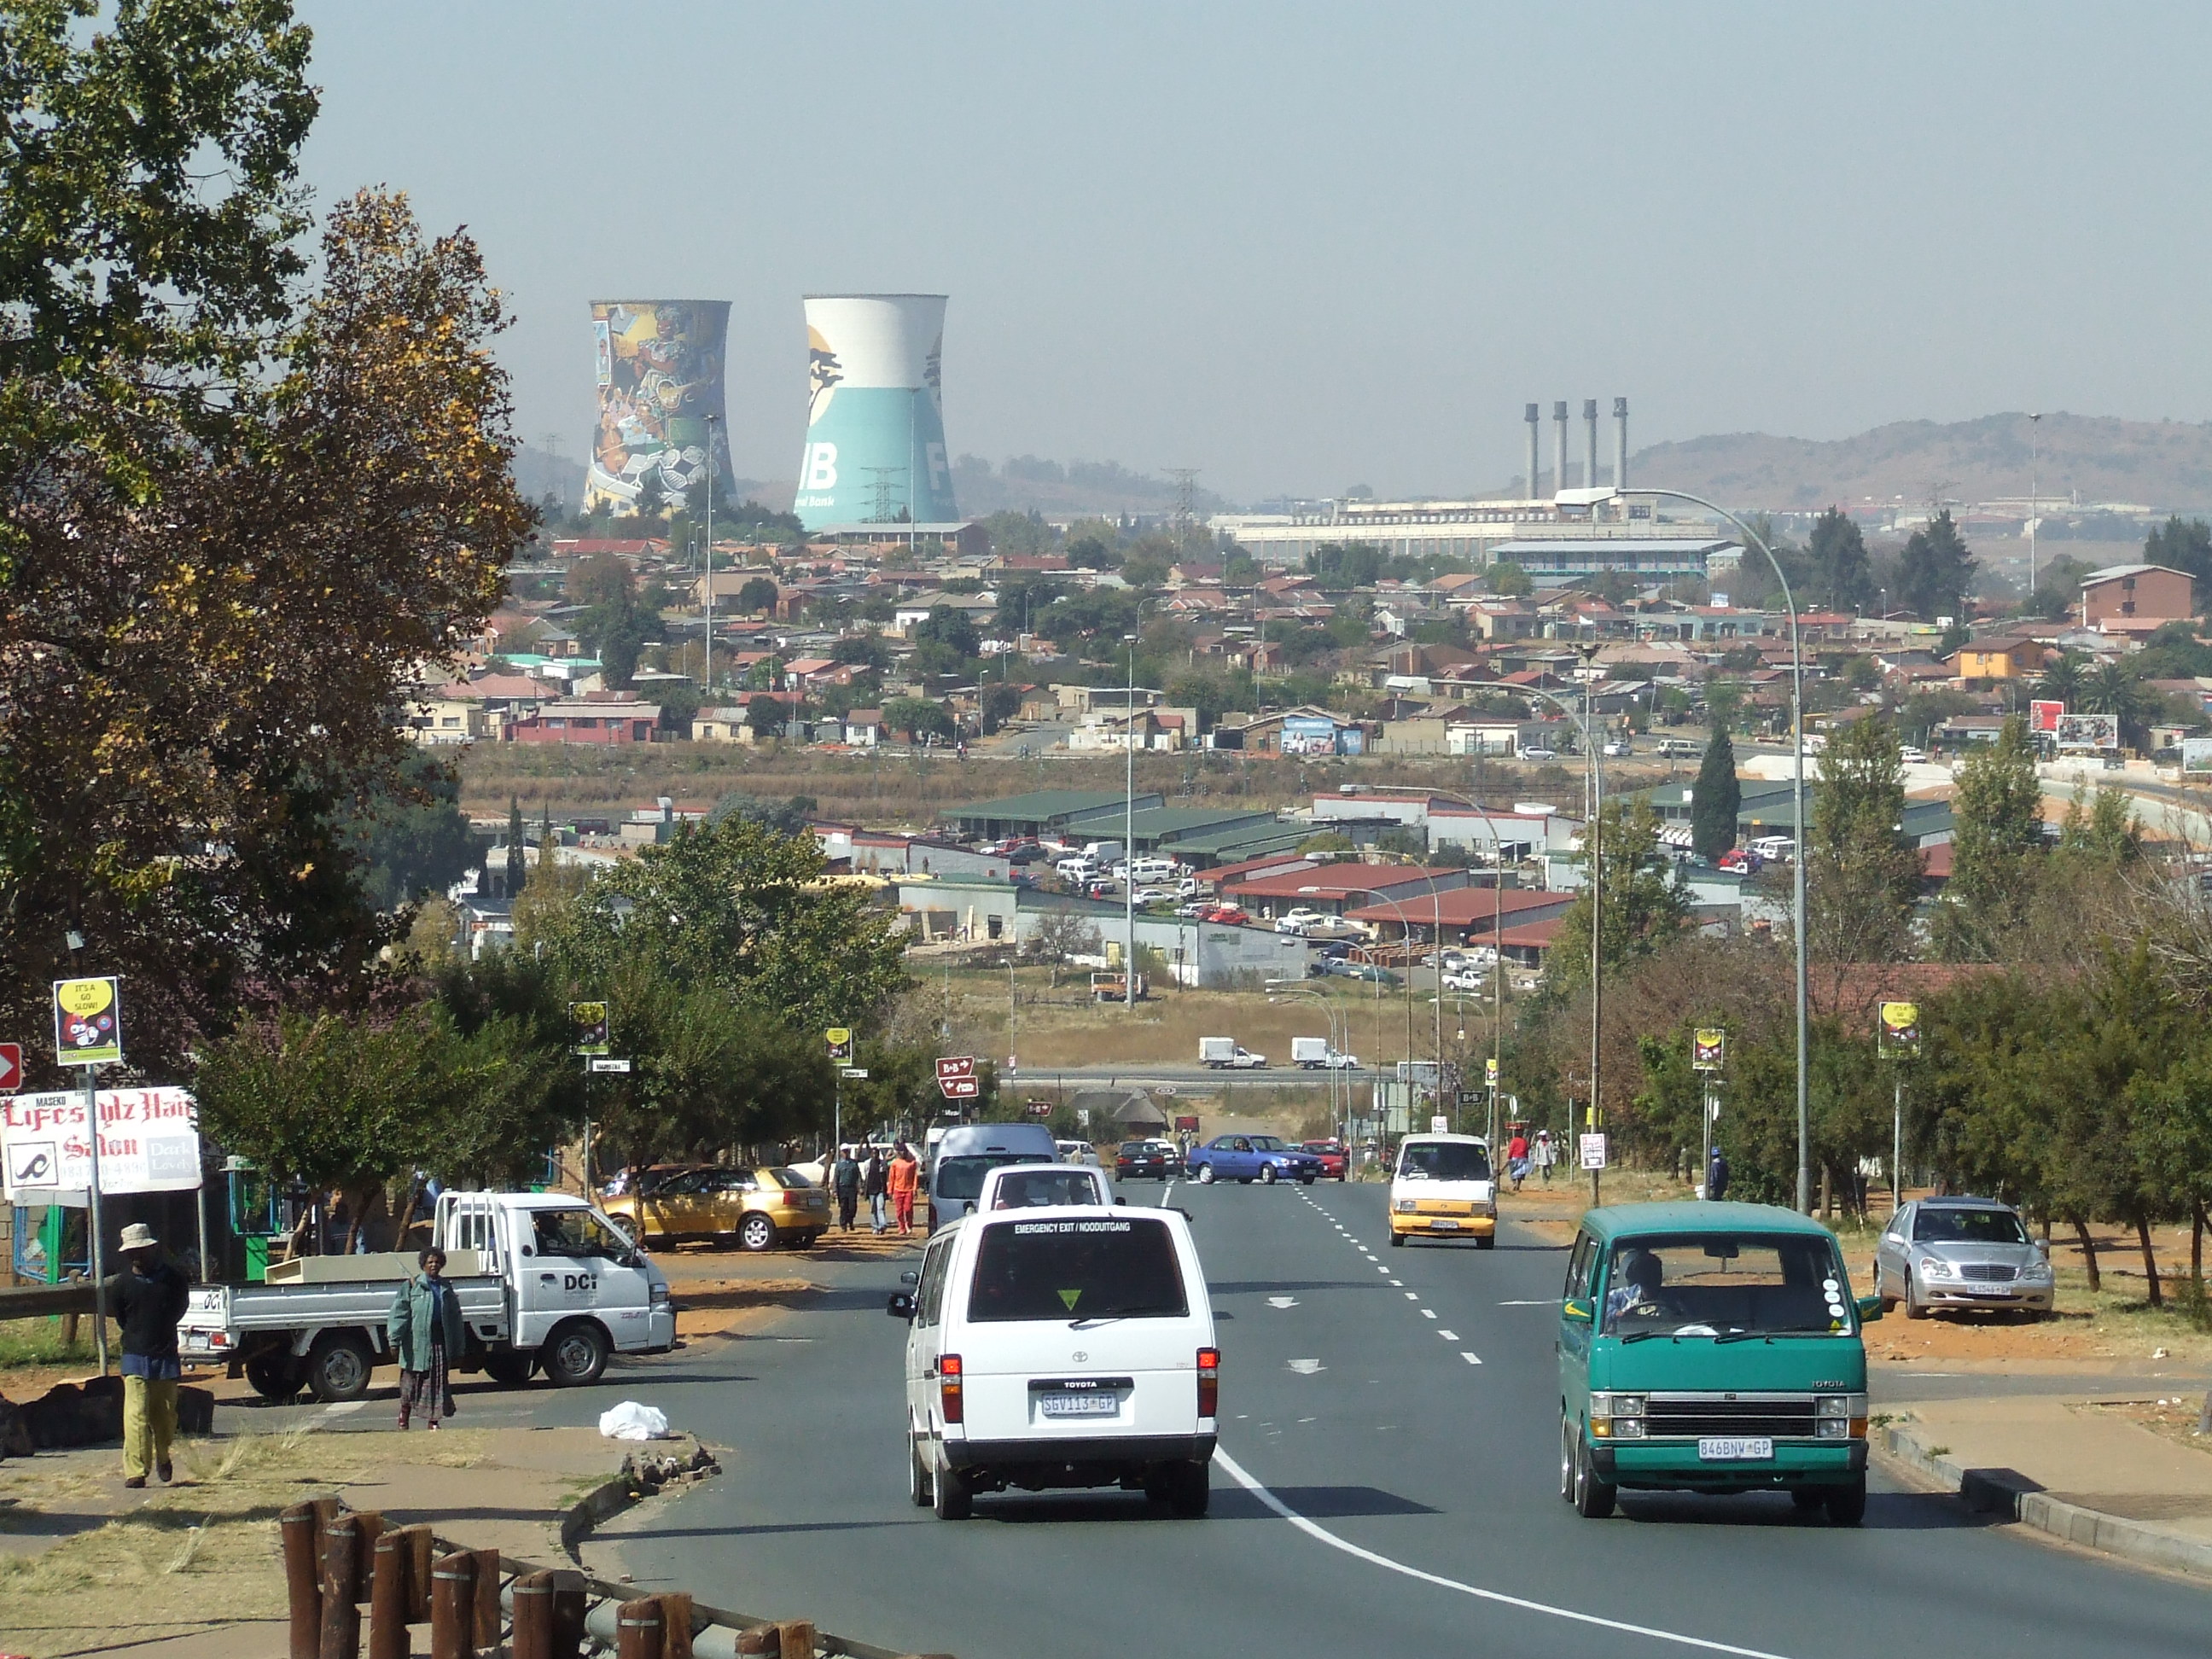
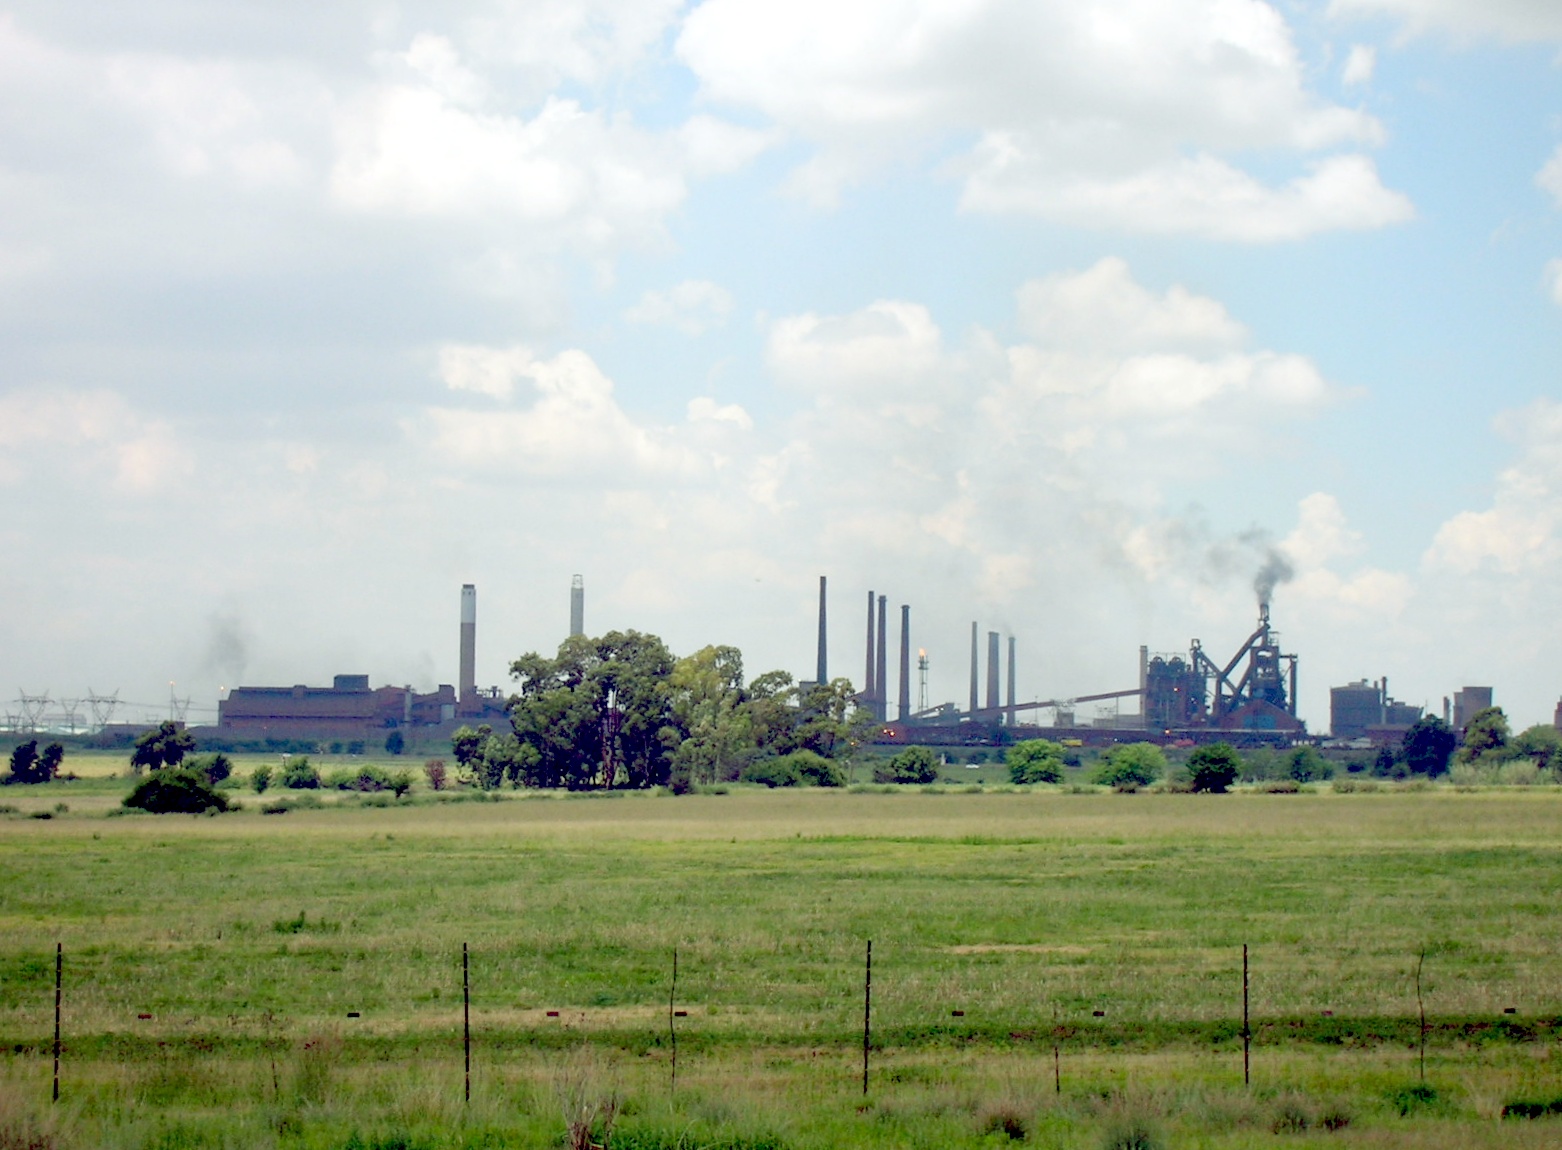
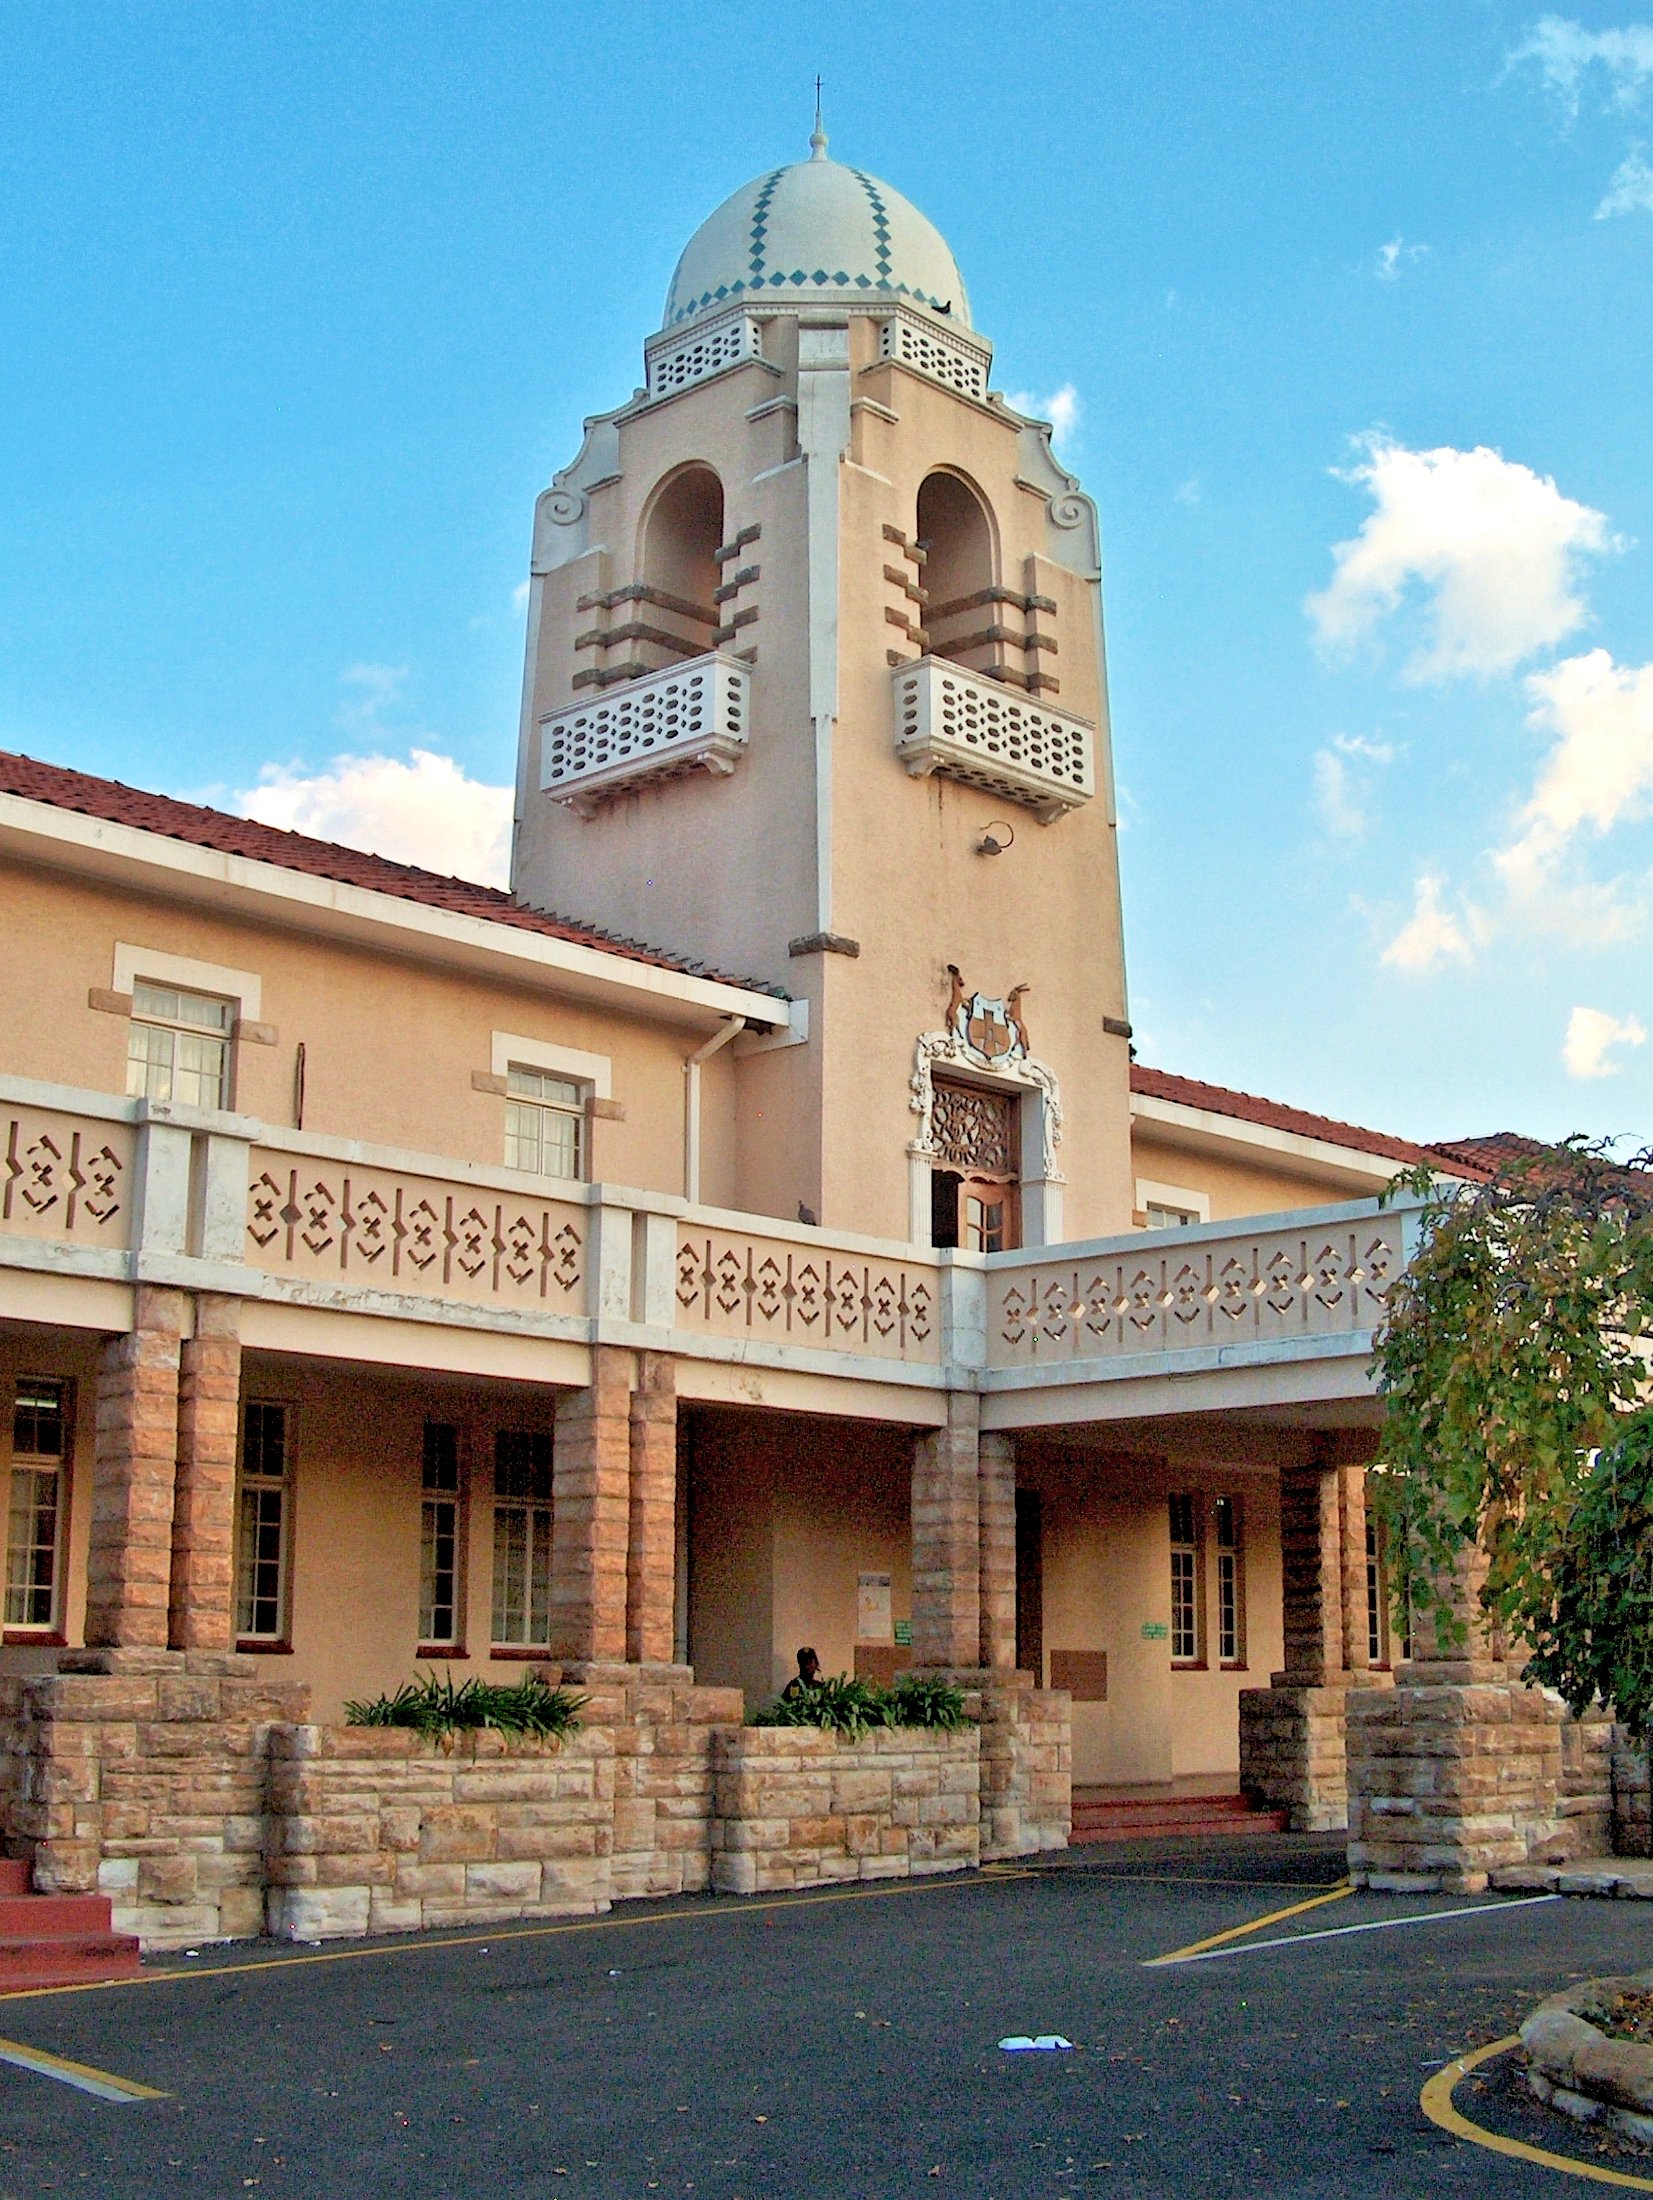
Vereeniging
Vereeniging (Afrikaans pronunciation: [fəˈreənəχɨŋ]) is a city in Gauteng province, South Africa, situated where the Klip River empties into the northern loop of the Vaal River. It is also one of the constituent parts of the Vaal Triangle region and ..
Vereeniging Wikipedia Page
About Our Data
The data on this page is estimated using a number of publicly available tools and resources. It is provided without warranty, and could contain inaccuracies. Use at your own risk.