Categories in Kitwe
Industries
Business Distribution by Industry in Kitwe
| Industry Description | Number of Establishments |
|---|---|
| Churches | 198 |
| Education | 197 |
| Shopping | 149 |
| Corporate management | 128 |
| Other accommodation | 118 |
| Restaurants | 113 |
| Bars, pubs and taverns | 96 |
| Electronics stores | 83 |
| Apartments | 74 |
| Grocery stores and supermarkets | 71 |
| Religion | 64 |
| Wholesale of construction supplies | 60 |
Kitwe Facts
| Area | 1011.7 km² |
| Population | 789,751 |
| Male Population | 392,101 (49.6%) |
| Female Population | 397,650 (50.4%) |
| Population change (1975 to 2020) | +374.4% |
| Population change (2000 to 2020) | +69.9% |
| Median Age | 19 years (Male: 19.4, Female: 18.6) |
| Neighborhoods | Buyantanshi, Martindale, Nkana West, Parklands, Mindolo |
| Local Time | |
| Timezone | Central Africa Time |
| Lat & Lng | -12.80243, 28.21323 |
Map of Kitwe
Interactive Map
Kitwe Population
Years 1975 to 2020
| Data | 1975 | 1990 | 2000 | 2015 | 2020 |
|---|---|---|---|---|---|
| Population | 166,458 | 343,047 | 464,717 | 700,452 | 789,751 |
| Population Density | 164.5 / km² | 339.1 / km² | 459.3 / km² | 692.4 / km² | 780.6 / km² |
Kitwe Population change from 2000 to 2015
Increase of 50.7% from year 2000 to 2015
| Location | Change since 1975 | Change since 1990 | Change since 2000 |
|---|---|---|---|
| Kitwe | +320.8% | +104.2% | +50.7% |
| Copperbelt Province | +231.2% | +79.8% | +40.4% |
| Zambia | +225.7% | +99.2% | +53.3% |
Kitwe Median Age
Median Age: 19 years
| Location | Median Age | Median Age (Female) | Median Age (Male) |
|---|---|---|---|
| Kitwe | 19 yrs | 18.6 yrs | 19.4 yrs |
| Copperbelt Province | 18.5 yrs | 18.3 yrs | 18.8 yrs |
| Zambia | 17 yrs | 17.1 yrs | 16.8 yrs |
Kitwe Population Density
Population Density: 781 / km²
| Location | Population | Area | Density |
|---|---|---|---|
| Kitwe | 789,751 | 1,011.7 km² | 781 / km² |
| Copperbelt Province | 2.4 million | 30,972.3 km² | 76.2 / km² |
| Zambia | 16.1 million | 751,093.4 km² | 21.5 / km² |
Kitwe Historical and Projected Population
Estimated Population from 1930 to 2100
- JRC (European Commission's Joint Research Centre) work on the GHS built-up grid
- CIESIN (Center for International Earth Science Information Network)
- [Link] Klein Goldewijk, K., Beusen, A., Doelman, J., and Stehfest, E.: Anthropogenic land use estimates for the Holocene – HYDE 3.2, Earth Syst. Sci. Data, 9, 927–953, https://doi.org/10.5194/essd-9-927-2017, 2017.
Neighborhoods in Kitwe
Percentage of businesses by neighborhood in Kitwe
Area Codes
Percentage Area Codes used by businesses in Kitwe
Price Distribution
Business distribution by price for Kitwe
Human Development Index (HDI)
Statistic composite index of life expectancy, education, and per capita income.
Kitwe CO2 Emissions
Carbon Dioxide (CO2) Emissions Per Capita in Tonnes Per Year
| Location | CO2 Emissions | CO2 Emissions Per Capita | CO2 Emissions Intensity |
|---|---|---|---|
| Kitwe | 322,273 tn | 0.41 tn | 318.5 tons/km² |
| Copperbelt Province | 947,485 tn | 0.4 tn | 30.6 tons/km² |
| Zambia | 6,494,218 tn | 0.4 tn | 8.6 tons/km² |
| 2013 CO2 emissions (tonnes/year) | 322,273 tn |
| 2013 CO2 emissions (tonnes/year) per capita | 0.41 tn |
| 2013 CO2 emissions intensity (tonnes/km²/year) | 318.5 tons/km² |
Natural Hazards Risk
Relative risk out of 10
| Hazard | Risk Level |
|---|---|
| Drought | High (9) |
* Risk, particularly concerning flood or landslide, may not be for the entire area.
- Dilley, M., R.S. Chen, U. Deichmann, A.L. Lerner-Lam, M. Arnold, J. Agwe, P. Buys, O. Kjekstad, B. Lyon, and G. Yetman. 2005. Natural Disaster Hotspots: A Global Risk Analysis. Washington, D.C.: World Bank. https://doi.org/10.1596/0-8213-5930-4.
- Center for Hazards and Risk Research - CHRR - Columbia University, Center for International Earth Science Information Network - CIESIN - Columbia University, and International Research Institute for Climate and Society - IRI - Columbia University. 2005. Global Drought Hazard Frequency and Distribution. Palisades, NY: NASA Socioeconomic Data and Applications Center (SEDAC). https://doi.org/10.7927/H4VX0DFT.
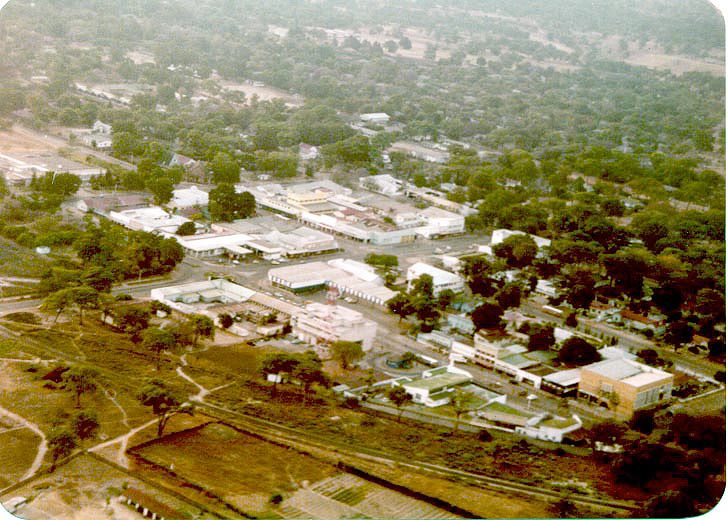
Kitwe
Kitwe is the second largest city in terms of size and population in Zambia. With a population of 504,194 (2010 census provisional) Kitwe is one of the most developed commercial and industrial areas in the nation, alongside Ndola and Lusaka. It has a ..
Kitwe Wikipedia Page


About Our Data
The data on this page is estimated using a number of publicly available tools and resources. It is provided without warranty, and could contain inaccuracies. Use at your own risk.