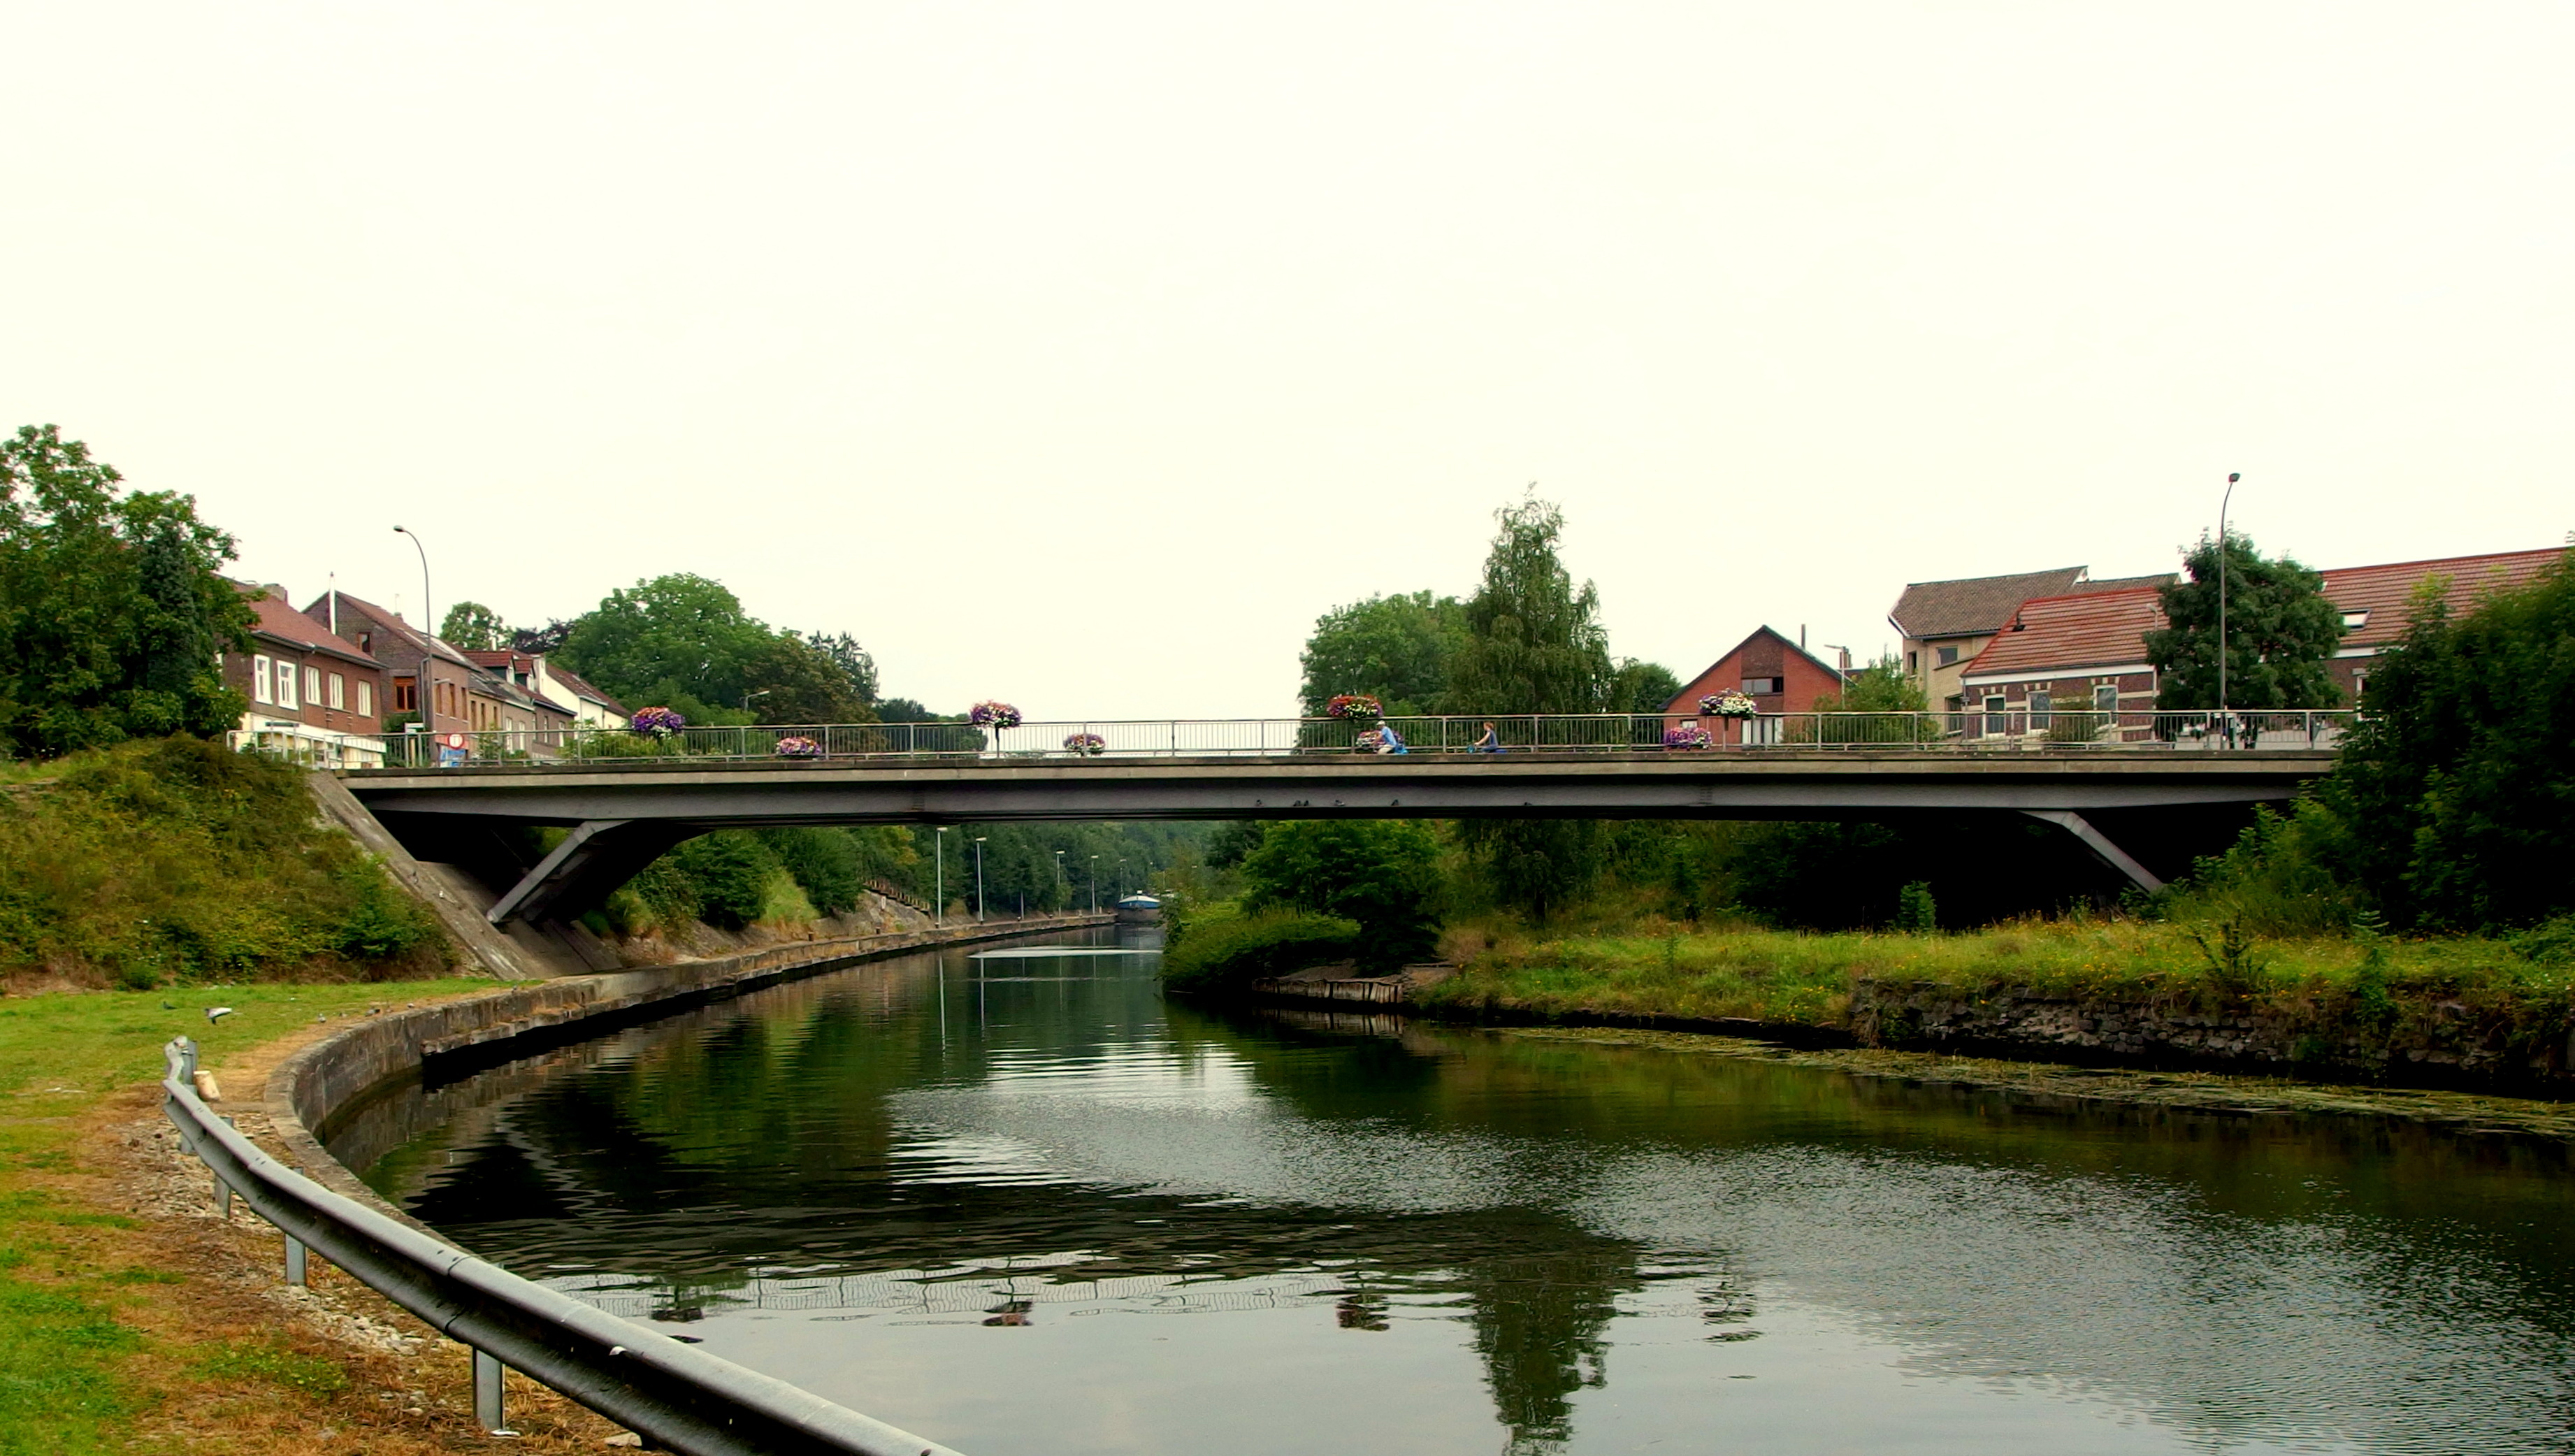
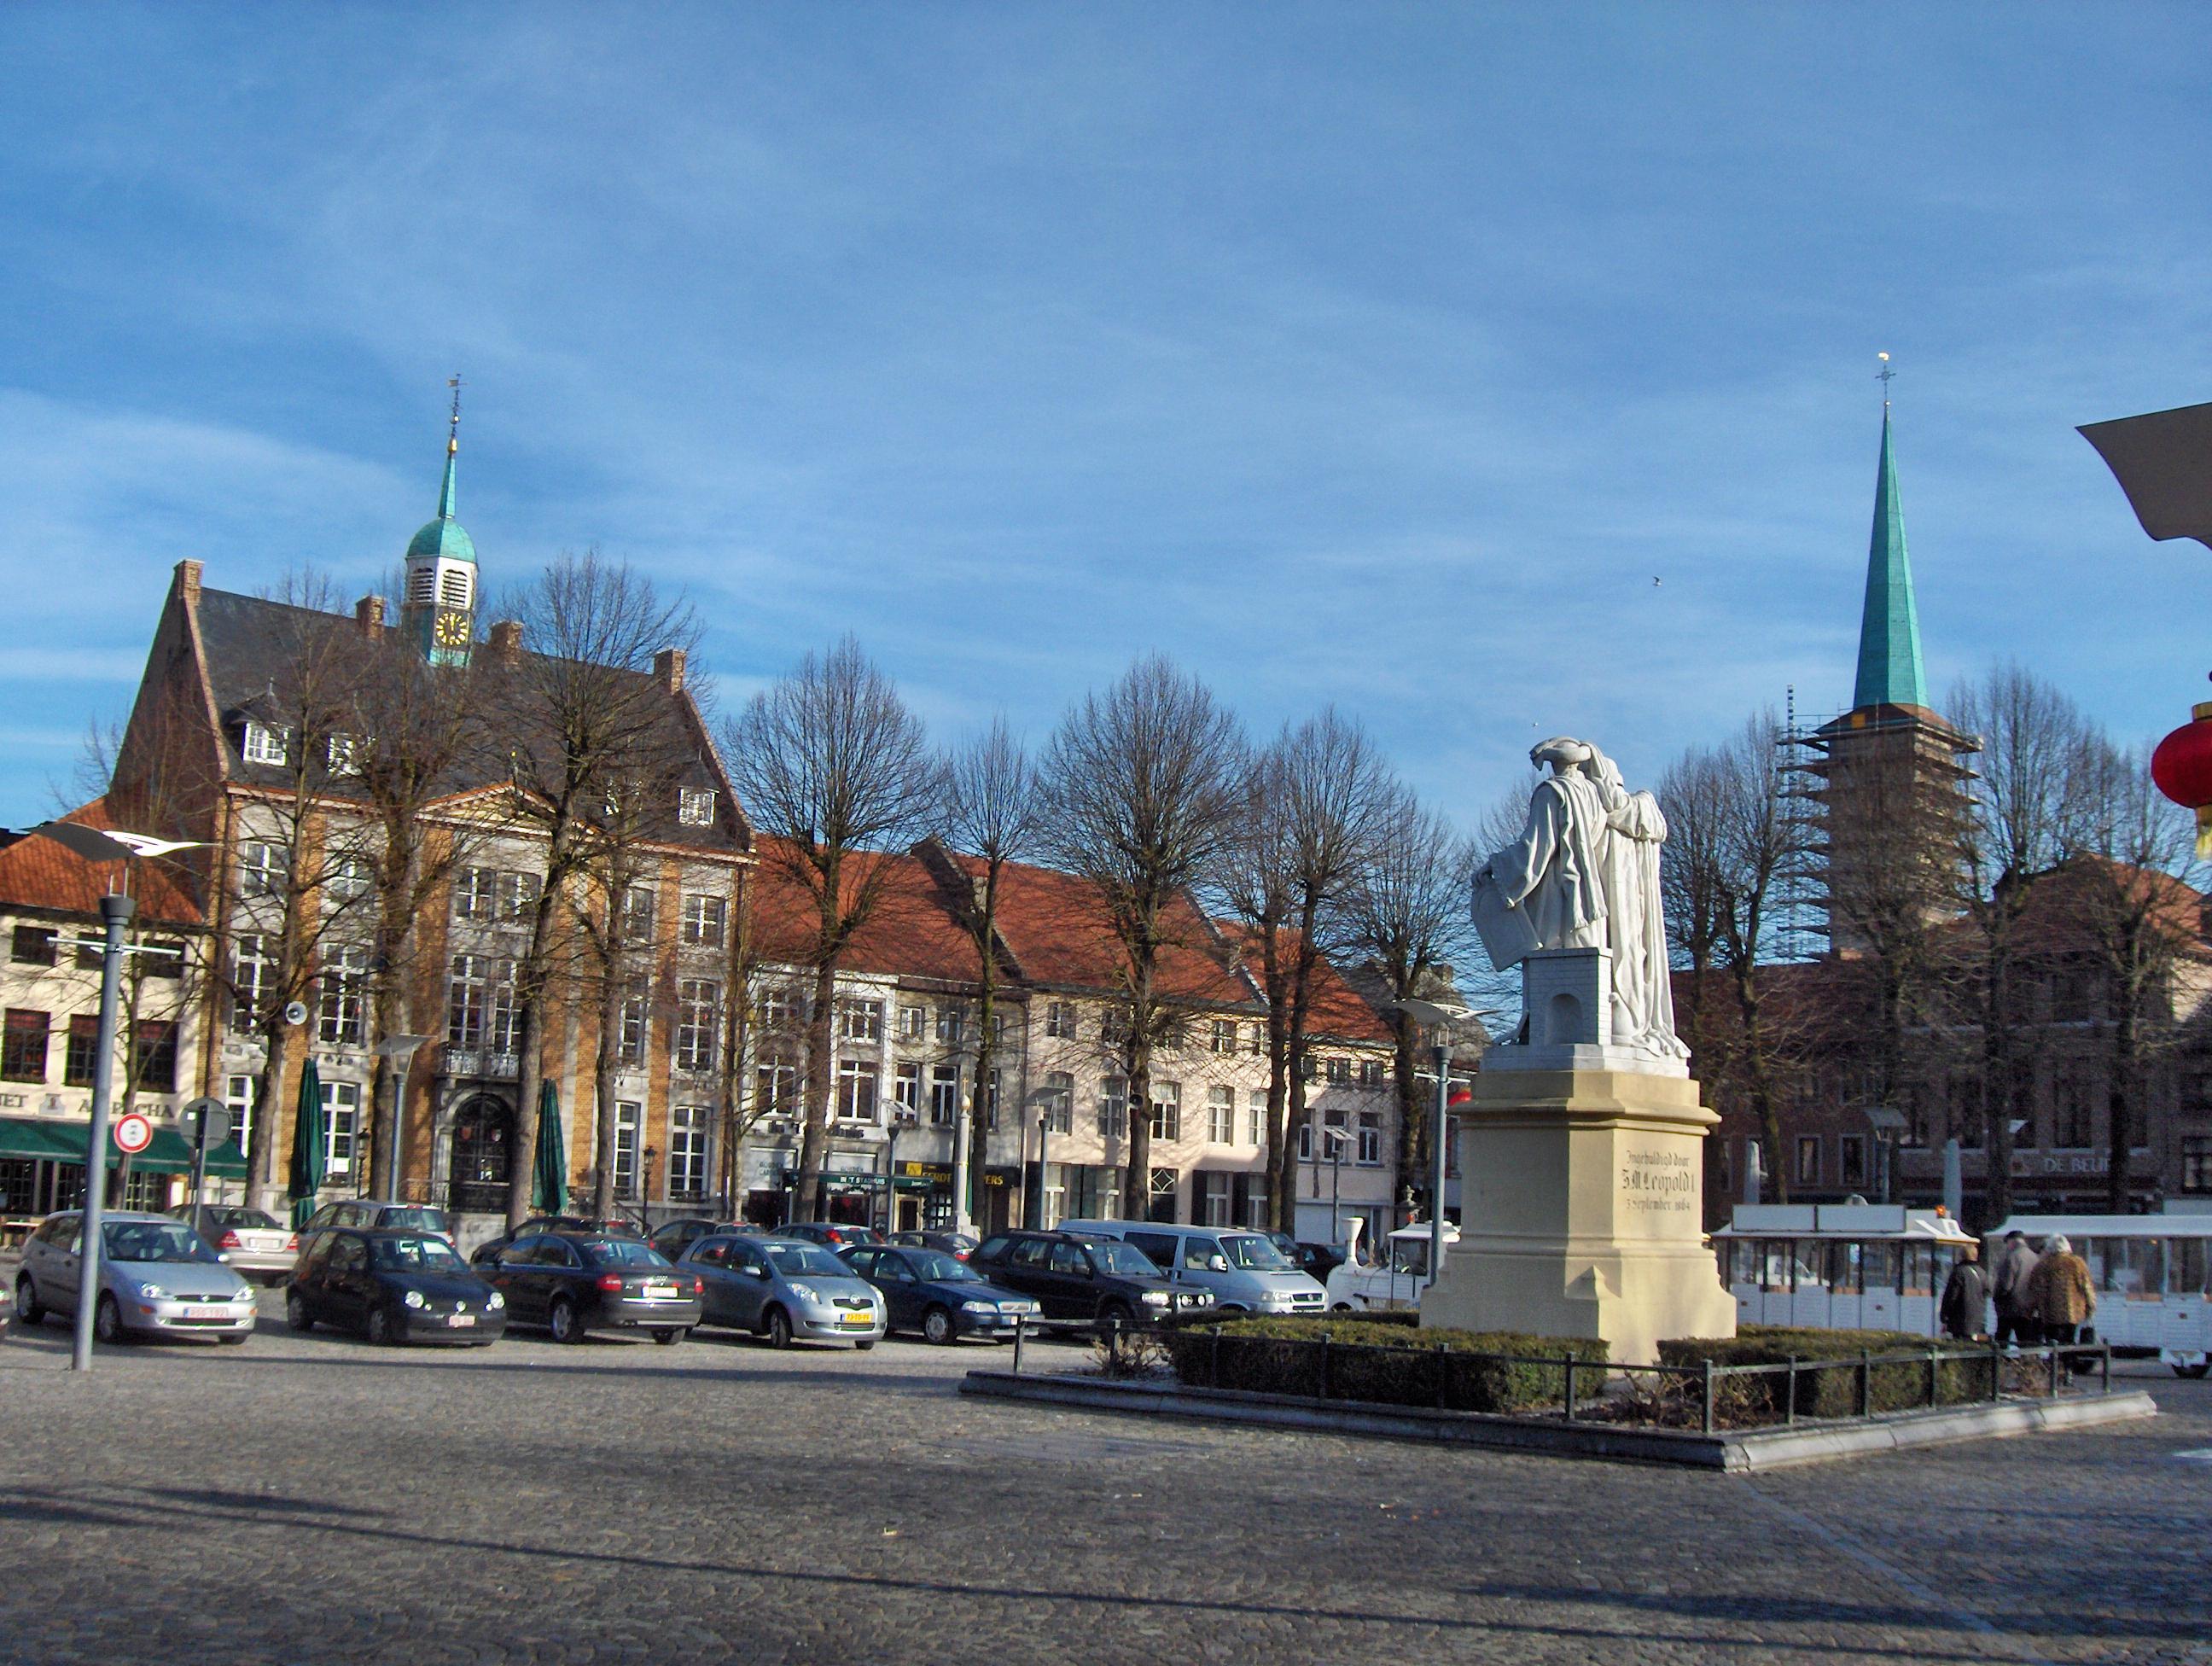
Leut Facts
| Area | 2.6 km² |
| Population | 2,109 |
| Male Population | 1,050 (49.8%) |
| Female Population | 1,059 (50.2%) |
| Population change (1975 to 2020) | -2.0% |
| Population change (2000 to 2020) | +9.3% |
| Median Age | 41.9 years (Male: 41.3, Female: 42.5) |
| Local Time | |
| Timezone | Central European Summer Time |
| Lat & Lng | 50.99107, 5.73624 |
Map of Leut
Interactive Map
Leut Population
Years 1975 to 2020
| Data | 1975 | 1990 | 2000 | 2015 | 2020 |
|---|---|---|---|---|---|
| Population | 2,152 | 2,117 | 1,930 | 2,058 | 2,109 |
| Population Density | 839.8 / km² | 826.1 / km² | 753.2 / km² | 803.1 / km² | 823 / km² |
Sources: JRC (European Commission's Joint Research Centre) work on the GHS built-up grid
Leut Population change from 2000 to 2015
Increase of 6.6% from year 2000 to 2015
| Location | Change since 1975 | Change since 1990 | Change since 2000 |
|---|---|---|---|
| Leut | -4.4% | -2.8% | +6.6% |
| Belgium | +15.7% | +13.2% | +10% |
Sources: JRC (European Commission's Joint Research Centre) work on the GHS built-up grid
Leut Median Age
Median Age: 41.9 years
| Location | Median Age | Median Age (Female) | Median Age (Male) |
|---|---|---|---|
| Leut | 41.9 yrs | 42.5 yrs | 41.3 yrs |
| Belgium | 41.3 yrs | 42.5 yrs | 40.3 yrs |
Sources: CIESIN (Center for International Earth Science Information Network)
Leut Population Density
Population Density: 823 / km²
| Location | Population | Area | Density |
|---|---|---|---|
| Leut | 2,109 | 2.563 km² | 823 / km² |
| Belgium | 11.3 million | 30,664.8 km² | 368 / km² |
Sources: JRC (European Commission's Joint Research Centre) work on the GHS built-up grid
Leut Historical and Projected Population
Estimated Population from 0 to 2100
Sources:
- JRC (European Commission's Joint Research Centre) work on the GHS built-up grid
- CIESIN (Center for International Earth Science Information Network)
- [Link] Klein Goldewijk, K., Beusen, A., Doelman, J., and Stehfest, E.: Anthropogenic land use estimates for the Holocene – HYDE 3.2, Earth Syst. Sci. Data, 9, 927–953, https://doi.org/10.5194/essd-9-927-2017, 2017.
Human Development Index (HDI)
Statistic composite index of life expectancy, education, and per capita income.
Source: [Link] Kummu, M., Taka, M. &Guillaume, J. Gridded global datasets for Gross Domestic Product and Human Development Index over 1990–2015. Sci Data 5, 180004 (2018) doi:10.1038/sdata.2018.4
Leut CO2 Emissions
Carbon Dioxide (CO2) Emissions Per Capita in Tonnes Per Year
| Location | CO2 Emissions | CO2 Emissions Per Capita | CO2 Emissions Intensity |
|---|---|---|---|
| Leut | 16,521 tn | 7.83 tn | 6,447.2 tons/km² |
| Belgium | 92,691,347 tn | 8.22 tn | 3,022.7 tons/km² |
Sources: [Link] Moran, D., Kanemoto K; Jiborn, M., Wood, R., Többen, J., and Seto, K.C. (2018) Carbon footprints of 13,000 cities. Environmental Research Letters DOI: 10.1088/1748-9326/aac72a
Leut CO2 Emissions
| 2013 CO2 emissions (tonnes/year) | 16,521 tn |
| 2013 CO2 emissions (tonnes/year) per capita | 7.83 tn |
| 2013 CO2 emissions intensity (tonnes/km²/year) | 6,447.2 tons/km² |
Natural Hazards Risk
Relative risk out of 10
| Hazard | Risk Level |
|---|---|
| Flood | Medium (7) |
| Earthquake | Medium (4) |
* Risk, particularly concerning flood or landslide, may not be for the entire area.
Sources:
- Dilley, M., R.S. Chen, U. Deichmann, A.L. Lerner-Lam, M. Arnold, J. Agwe, P. Buys, O. Kjekstad, B. Lyon, and G. Yetman. 2005. Natural Disaster Hotspots: A Global Risk Analysis. Washington, D.C.: World Bank. https://doi.org/10.1596/0-8213-5930-4.
- Center for Hazards and Risk Research - CHRR - Columbia University, Center for International Earth Science Information Network - CIESIN - Columbia University. 2005. Global Flood Hazard Frequency and Distribution. Palisades, NY: NASA Socioeconomic Data and Applications Center (SEDAC). https://doi.org/10.7927/H4668B3D.
- Center for Hazards and Risk Research - CHRR - Columbia University, Center for International Earth Science Information Network - CIESIN - Columbia University. 2005. Global Earthquake Hazard Distribution - Peak Ground Acceleration. Palisades, NY: NASA Socioeconomic Data and Applications Center (SEDAC). https://doi.org/10.7927/H4BZ63ZS.
Recent Nearby Earthquakes
Magnitude 3.0 and greater
| Date▼ | Time↕ | Magnitude↕ | Distance↕ | Depth↕ | Location↕ | Link |
|---|---|---|---|---|---|---|
| 9/8/11 | 7:02 PM | 4.2 | 79.6 km | 6,000 m | Germany | usgs.gov |
| 12/8/08 | 5:21 PM | 3 | 54.3 km | 2,000 m | Germany | usgs.gov |
| 3/11/08 | 6:17 PM | 3.4 | 68.5 km | 10,000 m | Germany | usgs.gov |
| 1/24/08 | 3:30 AM | 3.7 | 75.1 km | 10,000 m | Germany | usgs.gov |
| 11/25/07 | 3:10 AM | 3.7 | 61.5 km | 13,000 m | Belgium | usgs.gov |
| 3/31/07 | 6:46 AM | 3 | 57.5 km | 15,600 m | Belgium | usgs.gov |
| 11/28/06 | 8:19 AM | 3.1 | 17.3 km | 4,000 m | The Netherlands | usgs.gov |
| 5/20/05 | 7:38 AM | 3 | 52.4 km | 10,000 m | Belgium | usgs.gov |
| 7/17/04 | 11:16 PM | 3.4 | 40.4 km | 13,100 m | Germany | usgs.gov |
| 6/2/03 | 6:05 AM | 3.4 | 76.5 km | 5,000 m | Germany | usgs.gov |
Source: U.S. Geological Survey (USGS)

About Our Data
The data on this page is estimated using a number of publicly available tools and resources. It is provided without warranty, and could contain inaccuracies. Use at your own risk.