Categories in Valdivia
Industries
Business Distribution by Industry in Valdivia
| Industry Description | Number of Establishments | Average Age of Business |
|---|---|---|
| Restaurants | 454 | 15 years |
| Shopping | 412 | — |
| Other accommodation | 335 | 25 years |
| Construction of buildings | 277 | — |
| Grocery stores and supermarkets | 267 | — |
| Corporate management | 230 | 22 years |
| Education | 225 | 49 years |
| Real estate | 167 | — |
| Hotels and motels | 162 | — |
| Public administration | 143 | — |
| Health and medical | 142 | — |
Valdivia Facts
| Area | 159.4 km² |
| Population | 168,922 |
| Male Population | 83,169 (49.2%) |
| Female Population | 85,753 (50.8%) |
| Population change (1975 to 2020) | +121.6% |
| Population change (2000 to 2020) | +23.3% |
| Median Age | 30.8 years (Male: 29.7, Female: 31.9) |
| Area Codes | 63 |
| Neighborhoods | Isla Teja, Las Animas, Int, DP Int, Dp Adsl |
| Local Time | |
| Timezone | Chile Standard Time |
| Lat & Lng | -39.81422, -73.24589 |
| Postal Codes | 5090000, 5190000 |
Map of Valdivia
Interactive Map
Valdivia Population
Years 1975 to 2020
| Data | 1975 | 1990 | 2000 | 2015 | 2020 |
|---|---|---|---|---|---|
| Population | 76,220 | 112,907 | 137,009 | 162,328 | 168,922 |
| Population Density | 478.1 / km² | 708.2 / km² | 859.3 / km² | 1,018.1 / km² | 1,059.5 / km² |
Valdivia Population change from 2000 to 2015
Increase of 18.5% from year 2000 to 2015
| Location | Change since 1975 | Change since 1990 | Change since 2000 |
|---|---|---|---|
| Valdivia | +113% | +43.8% | +18.5% |
| Los Ríos Region | — | — | — |
| Chile | +72.2% | +36.6% | +18.3% |
Valdivia Median Age
Median Age: 30.8 years
| Location | Median Age | Median Age (Female) | Median Age (Male) |
|---|---|---|---|
| Valdivia | 30.8 yrs | 31.9 yrs | 29.7 yrs |
| Los Ríos Region | 32.6 yrs | 32.7 yrs | 32.6 yrs |
| Chile | 31.3 yrs | 32 yrs | 30.6 yrs |
Valdivia Population Density
Population Density: 1,060 / km²
| Location | Population | Area | Density |
|---|---|---|---|
| Valdivia | 168,922 | 159.4 km² | 1,060 / km² |
| Chile | 17.8 million | 751,744.8 km² | 23.7 / km² |
Valdivia Historical and Projected Population
Estimated Population from 1860 to 2100
- JRC (European Commission's Joint Research Centre) work on the GHS built-up grid
- CIESIN (Center for International Earth Science Information Network)
- [Link] Klein Goldewijk, K., Beusen, A., Doelman, J., and Stehfest, E.: Anthropogenic land use estimates for the Holocene – HYDE 3.2, Earth Syst. Sci. Data, 9, 927–953, https://doi.org/10.5194/essd-9-927-2017, 2017.
Neighborhoods in Valdivia
Percentage of businesses by neighborhood in Valdivia
Price Distribution
Business distribution by price for Valdivia
Human Development Index (HDI)
Statistic composite index of life expectancy, education, and per capita income.
Valdivia CO2 Emissions
Carbon Dioxide (CO2) Emissions Per Capita in Tonnes Per Year
| Location | CO2 Emissions | CO2 Emissions Per Capita | CO2 Emissions Intensity |
|---|---|---|---|
| Valdivia | 734,560 tn | 4.35 tn | 4,607.2 tons/km² |
| Chile | 87,296,657 tn | 4.91 tn | 116.1 tons/km² |
| 2013 CO2 emissions (tonnes/year) | 734,560 tn |
| 2013 CO2 emissions (tonnes/year) per capita | 4.35 tn |
| 2013 CO2 emissions intensity (tonnes/km²/year) | 4,607.2 tons/km² |
Natural Hazards Risk
Relative risk out of 10
| Hazard | Risk Level |
|---|---|
| Earthquake | Medium (7) |
| Landslide | High (9) |
* Risk, particularly concerning flood or landslide, may not be for the entire area.
- Dilley, M., R.S. Chen, U. Deichmann, A.L. Lerner-Lam, M. Arnold, J. Agwe, P. Buys, O. Kjekstad, B. Lyon, and G. Yetman. 2005. Natural Disaster Hotspots: A Global Risk Analysis. Washington, D.C.: World Bank. https://doi.org/10.1596/0-8213-5930-4.
- Center for Hazards and Risk Research - CHRR - Columbia University, Center for International Earth Science Information Network - CIESIN - Columbia University, and Norwegian Geotechnical Institute - NGI. 2005. Global Landslide Hazard Distribution. Palisades, NY: NASA Socioeconomic Data and Applications Center (SEDAC). https://doi.org/10.7927/H4P848VZ.
- Center for Hazards and Risk Research - CHRR - Columbia University, Center for International Earth Science Information Network - CIESIN - Columbia University. 2005. Global Earthquake Hazard Distribution - Peak Ground Acceleration. Palisades, NY: NASA Socioeconomic Data and Applications Center (SEDAC). https://doi.org/10.7927/H4BZ63ZS.
Recent Nearby Earthquakes
Magnitude 3.0 and greater
| Date▼ | Time↕ | Magnitude↕ | Distance↕ | Depth↕ | Location↕ | Link |
|---|---|---|---|---|---|---|
| 6/8/19 | 1:44 PM | 4.7 | 94 km | 89,330 m | 11km WSW of Villarrica, Chile | usgs.gov |
| 5/22/19 | 4:23 AM | 4.6 | 74 km | 61,370 m | 13km S of Rio Bueno, Chile | usgs.gov |
| 3/25/19 | 4:32 PM | 4.1 | 73.2 km | 95,920 m | 19km SE of Loncoche, Chile | usgs.gov |
| 1/18/19 | 12:34 PM | 4.3 | 87.3 km | 62,220 m | 7km ESE of Osorno, Chile | usgs.gov |
| 9/19/18 | 11:28 AM | 4.1 | 22.9 km | 60,840 m | 20km ENE of Las Animas, Chile | usgs.gov |
| 12/8/17 | 9:28 AM | 4.1 | 77.8 km | 78,280 m | 27km E of Rio Bueno, Chile | usgs.gov |
| 7/3/17 | 4:45 PM | 4.3 | 87.8 km | 12,120 m | 49km SW of Carahue, Chile | usgs.gov |
| 5/20/17 | 2:13 PM | 4 | 95.3 km | 10,000 m | 34km SSW of Carahue, Chile | usgs.gov |
| 1/9/17 | 8:08 AM | 4.2 | 46.3 km | 63,130 m | 45km N of Las Animas, Chile | usgs.gov |
| 11/5/16 | 8:21 AM | 4.3 | 50.1 km | 24,430 m | 40km NW of Corral, Chile | usgs.gov |
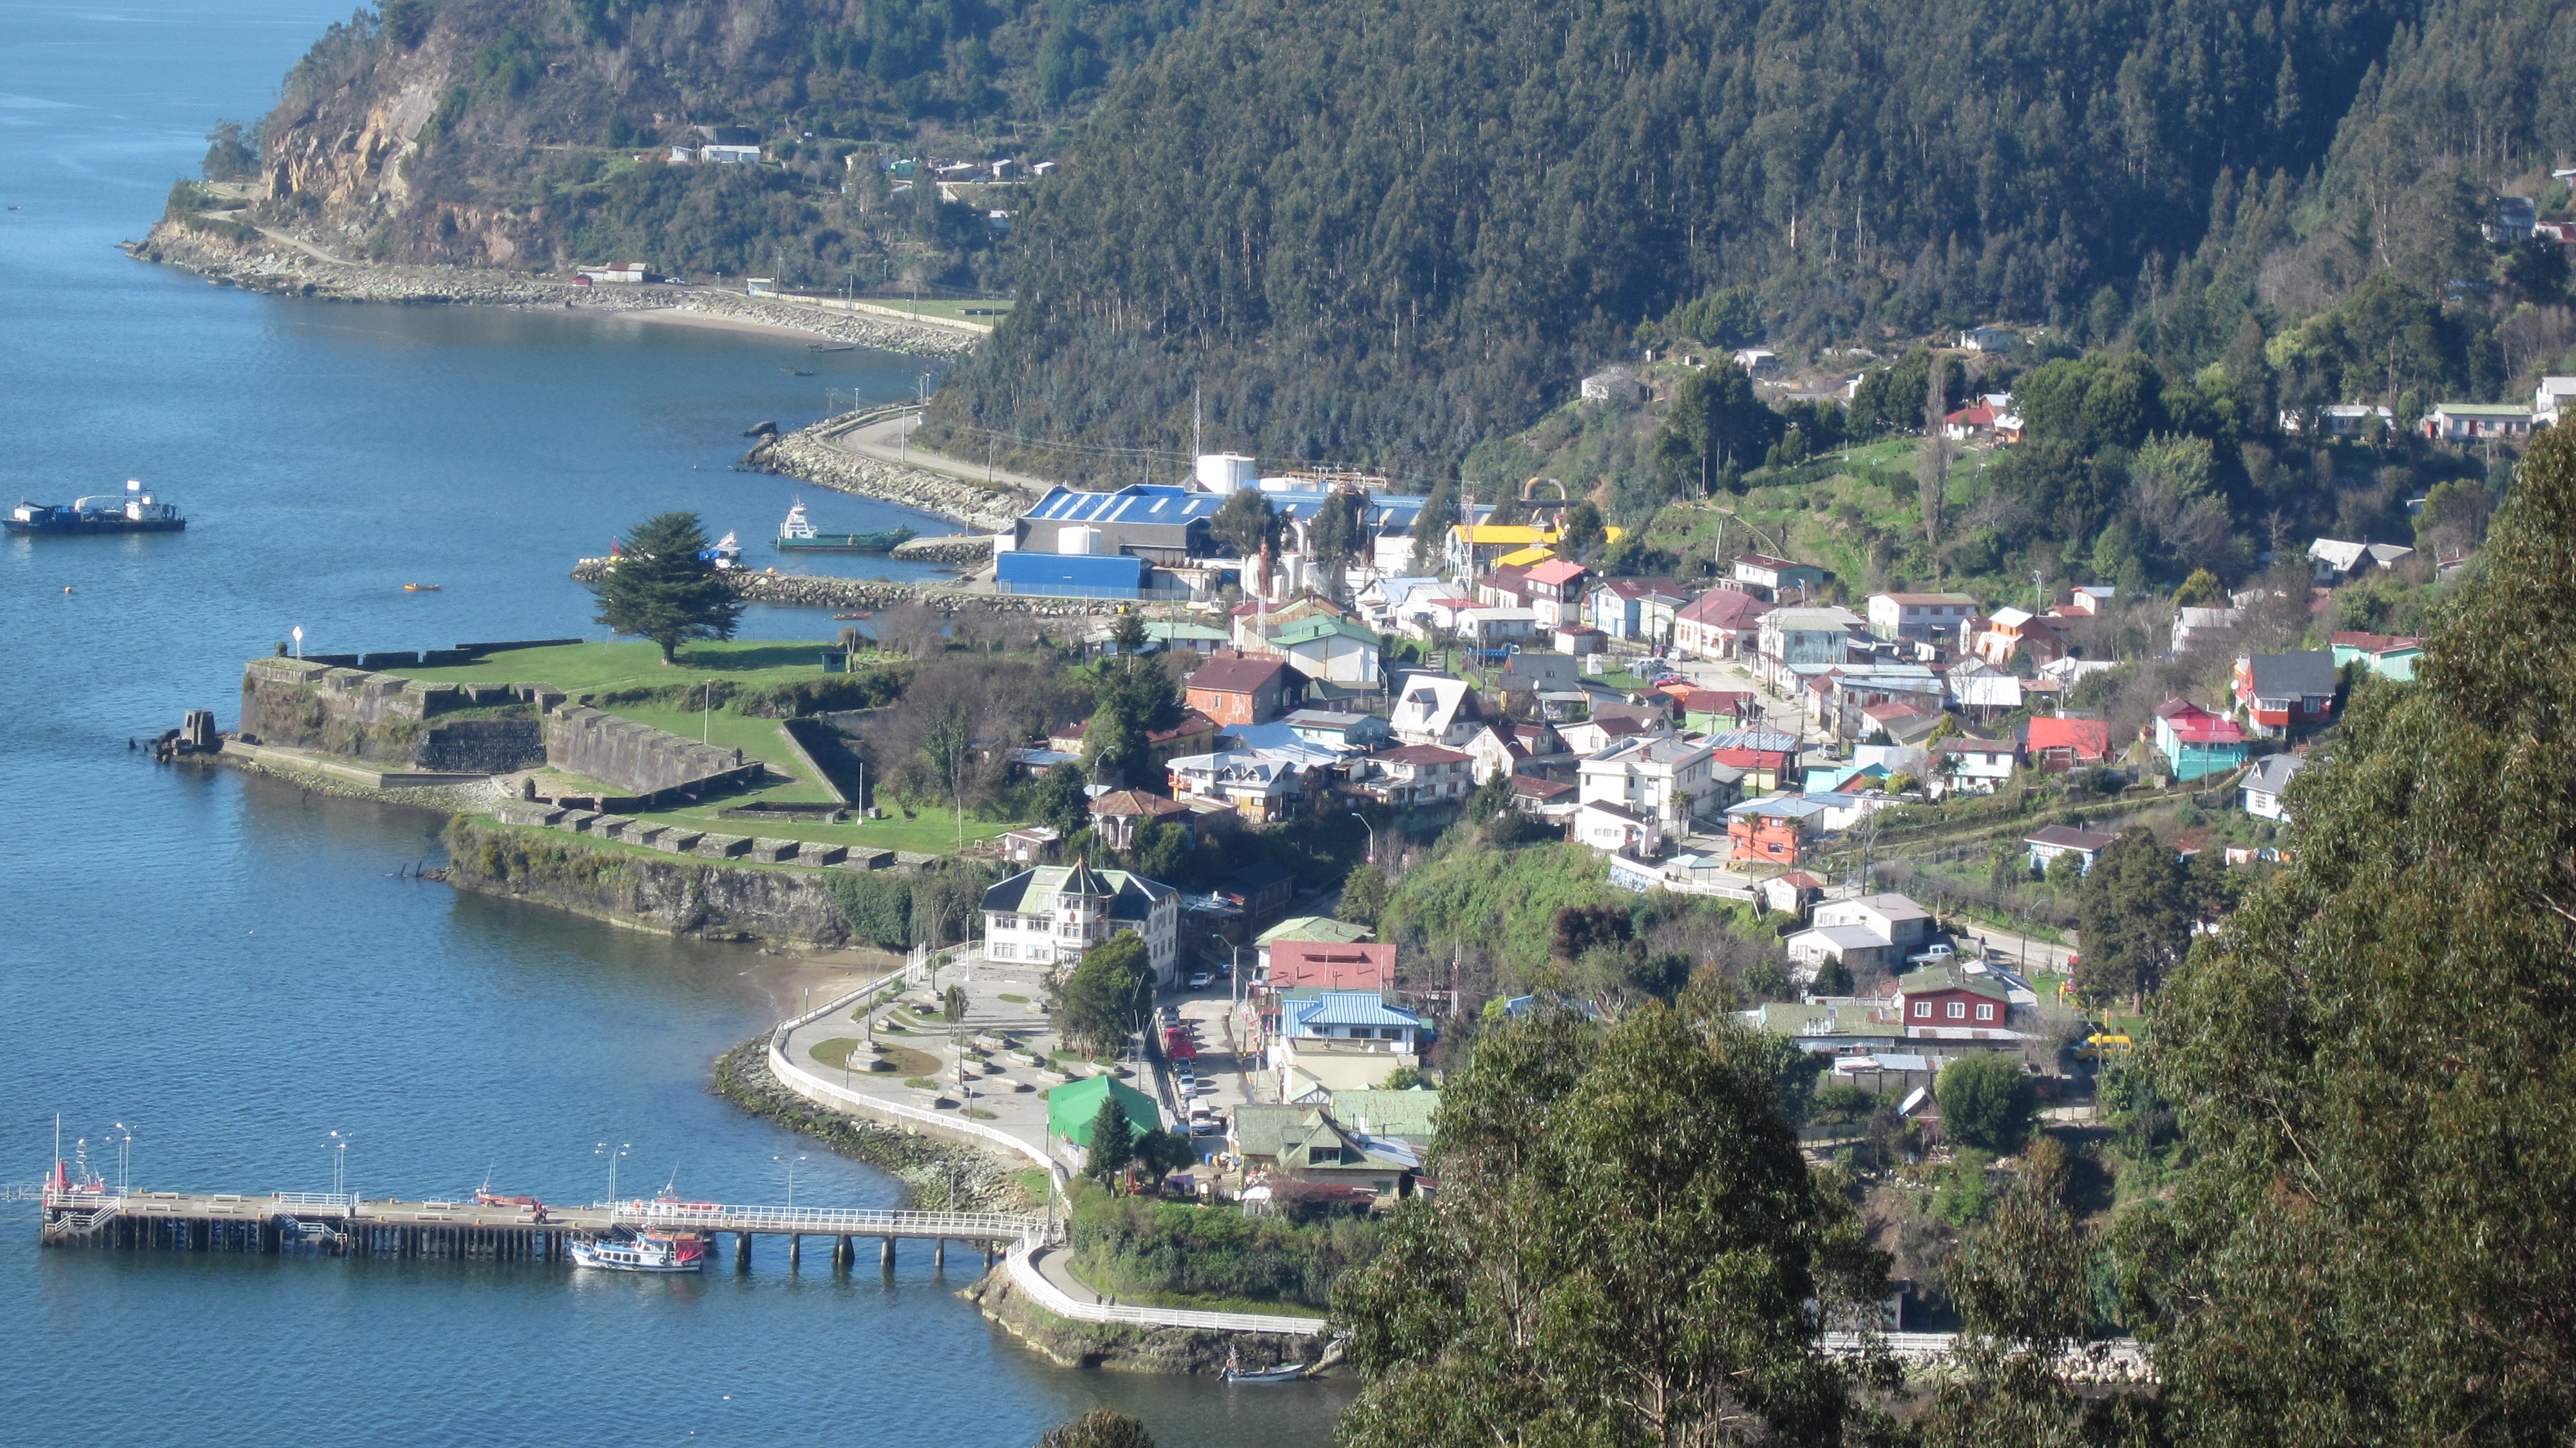
Valdivia
Valdivia (Spanish pronunciation: [balˈd̪iβja]) is a city and commune in southern Chile, administered by the Municipality of Valdivia. The city is named after its founder Pedro de Valdivia and is located at the confluence of the Calle-Calle, Valdivia,..
Valdivia Wikipedia Page

About Our Data
The data on this page is estimated using a number of publicly available tools and resources. It is provided without warranty, and could contain inaccuracies. Use at your own risk.