Categories in Sewen
Industries
Business Distribution by Industry in Sewen
| Industry Description | Number of Establishments |
|---|---|
| Other accommodation | 16 |
| Restaurants | 9 |
Sewen Facts
| Area | 21.4 km² |
| Population | 527 |
| Male Population | 269 (51.1%) |
| Female Population | 258 (48.9%) |
| Population change (1975 to 2020) | -1.1% |
| Population change (2000 to 2020) | -1.7% |
| Median Age | 43.4 years (Male: 40.9, Female: 45.5) |
| Local Time | |
| Timezone | Central European Summer Time |
| Lat & Lng | 47.80716, 6.90568 |
Map of Sewen
Interactive Map
Sewen Population
Years 1975 to 2020
| Data | 1975 | 1990 | 2000 | 2015 | 2020 |
|---|---|---|---|---|---|
| Population | 533 | 540 | 536 | 529 | 527 |
| Population Density | 24.9 / km² | 25.2 / km² | 25 / km² | 24.7 / km² | 24.6 / km² |
Sewen Population change from 2000 to 2015
Decrease of 1.3% from year 2000 to 2015
| Location | Change since 1975 | Change since 1990 | Change since 2000 |
|---|---|---|---|
| Sewen | -0.8% | -2% | -1.3% |
| France | +22.7% | +13.8% | +8.8% |
Sewen Median Age
Median Age: 43.4 years
| Location | Median Age | Median Age (Female) | Median Age (Male) |
|---|---|---|---|
| Sewen | 43.4 yrs | 45.5 yrs | 40.9 yrs |
| France | 39.6 yrs | 41 yrs | 38.1 yrs |
Sewen Population Density
Population Density: 24.6 / km²
| Location | Population | Area | Density |
|---|---|---|---|
| Sewen | 527 | 21.4 km² | 24.6 / km² |
| France | 65.9 million | 638,022.5 km² | 103 / km² |
Sewen Historical and Projected Population
Estimated Population from 0 to 2100
- JRC (European Commission's Joint Research Centre) work on the GHS built-up grid
- CIESIN (Center for International Earth Science Information Network)
- [Link] Klein Goldewijk, K., Beusen, A., Doelman, J., and Stehfest, E.: Anthropogenic land use estimates for the Holocene – HYDE 3.2, Earth Syst. Sci. Data, 9, 927–953, https://doi.org/10.5194/essd-9-927-2017, 2017.
Human Development Index (HDI)
Statistic composite index of life expectancy, education, and per capita income.
Sewen CO2 Emissions
Carbon Dioxide (CO2) Emissions Per Capita in Tonnes Per Year
| Location | CO2 Emissions | CO2 Emissions Per Capita | CO2 Emissions Intensity |
|---|---|---|---|
| Sewen | 4,374 tn | 8.3 tn | 204 tons/km² |
| France | 485,797,691 tn | 7.38 tn | 761.4 tons/km² |
| 2013 CO2 emissions (tonnes/year) | 4,374 tn |
| 2013 CO2 emissions (tonnes/year) per capita | 8.3 tn |
| 2013 CO2 emissions intensity (tonnes/km²/year) | 204 tons/km² |
Natural Hazards Risk
Relative risk out of 10
| Hazard | Risk Level |
|---|---|
| Flood | Medium (7) |
| Earthquake | Medium (4) |
| Landslide | Medium (6) |
* Risk, particularly concerning flood or landslide, may not be for the entire area.
- Dilley, M., R.S. Chen, U. Deichmann, A.L. Lerner-Lam, M. Arnold, J. Agwe, P. Buys, O. Kjekstad, B. Lyon, and G. Yetman. 2005. Natural Disaster Hotspots: A Global Risk Analysis. Washington, D.C.: World Bank. https://doi.org/10.1596/0-8213-5930-4.
- Center for Hazards and Risk Research - CHRR - Columbia University, Center for International Earth Science Information Network - CIESIN - Columbia University, and Norwegian Geotechnical Institute - NGI. 2005. Global Landslide Hazard Distribution. Palisades, NY: NASA Socioeconomic Data and Applications Center (SEDAC). https://doi.org/10.7927/H4P848VZ.
- Center for Hazards and Risk Research - CHRR - Columbia University, Center for International Earth Science Information Network - CIESIN - Columbia University. 2005. Global Flood Hazard Frequency and Distribution. Palisades, NY: NASA Socioeconomic Data and Applications Center (SEDAC). https://doi.org/10.7927/H4668B3D.
- Center for Hazards and Risk Research - CHRR - Columbia University, Center for International Earth Science Information Network - CIESIN - Columbia University. 2005. Global Earthquake Hazard Distribution - Peak Ground Acceleration. Palisades, NY: NASA Socioeconomic Data and Applications Center (SEDAC). https://doi.org/10.7927/H4BZ63ZS.
Recent Nearby Earthquakes
Magnitude 3.0 and greater
| Date▼ | Time↕ | Magnitude↕ | Distance↕ | Depth↕ | Location↕ | Link |
|---|---|---|---|---|---|---|
| 8/19/07 | 7:32 AM | 3.9 | 61.8 km | 11,300 m | France | usgs.gov |
| 8/17/07 | 5:43 AM | 3.5 | 62.9 km | 10,000 m | France | usgs.gov |
| 8/13/07 | 6:00 AM | 3 | 61.4 km | 10,000 m | France | usgs.gov |
| 8/7/07 | 6:46 AM | 3.1 | 60.4 km | 13,000 m | France | usgs.gov |
| 4/8/07 | 7:30 PM | 3.1 | 62.9 km | 10,000 m | France | usgs.gov |
| 4/3/07 | 1:43 PM | 3.2 | 62.4 km | 11,700 m | France | usgs.gov |
| 7/20/05 | 3:21 PM | 3.3 | 62.9 km | 10,000 m | France | usgs.gov |
| 6/9/05 | 11:58 PM | 3.3 | 63.1 km | 5,000 m | France | usgs.gov |
| 6/8/05 | 10:21 AM | 3.5 | 61.4 km | 12,100 m | France | usgs.gov |
| 3/16/05 | 3:41 AM | 3.1 | 45.8 km | 8,000 m | Switzerland | usgs.gov |
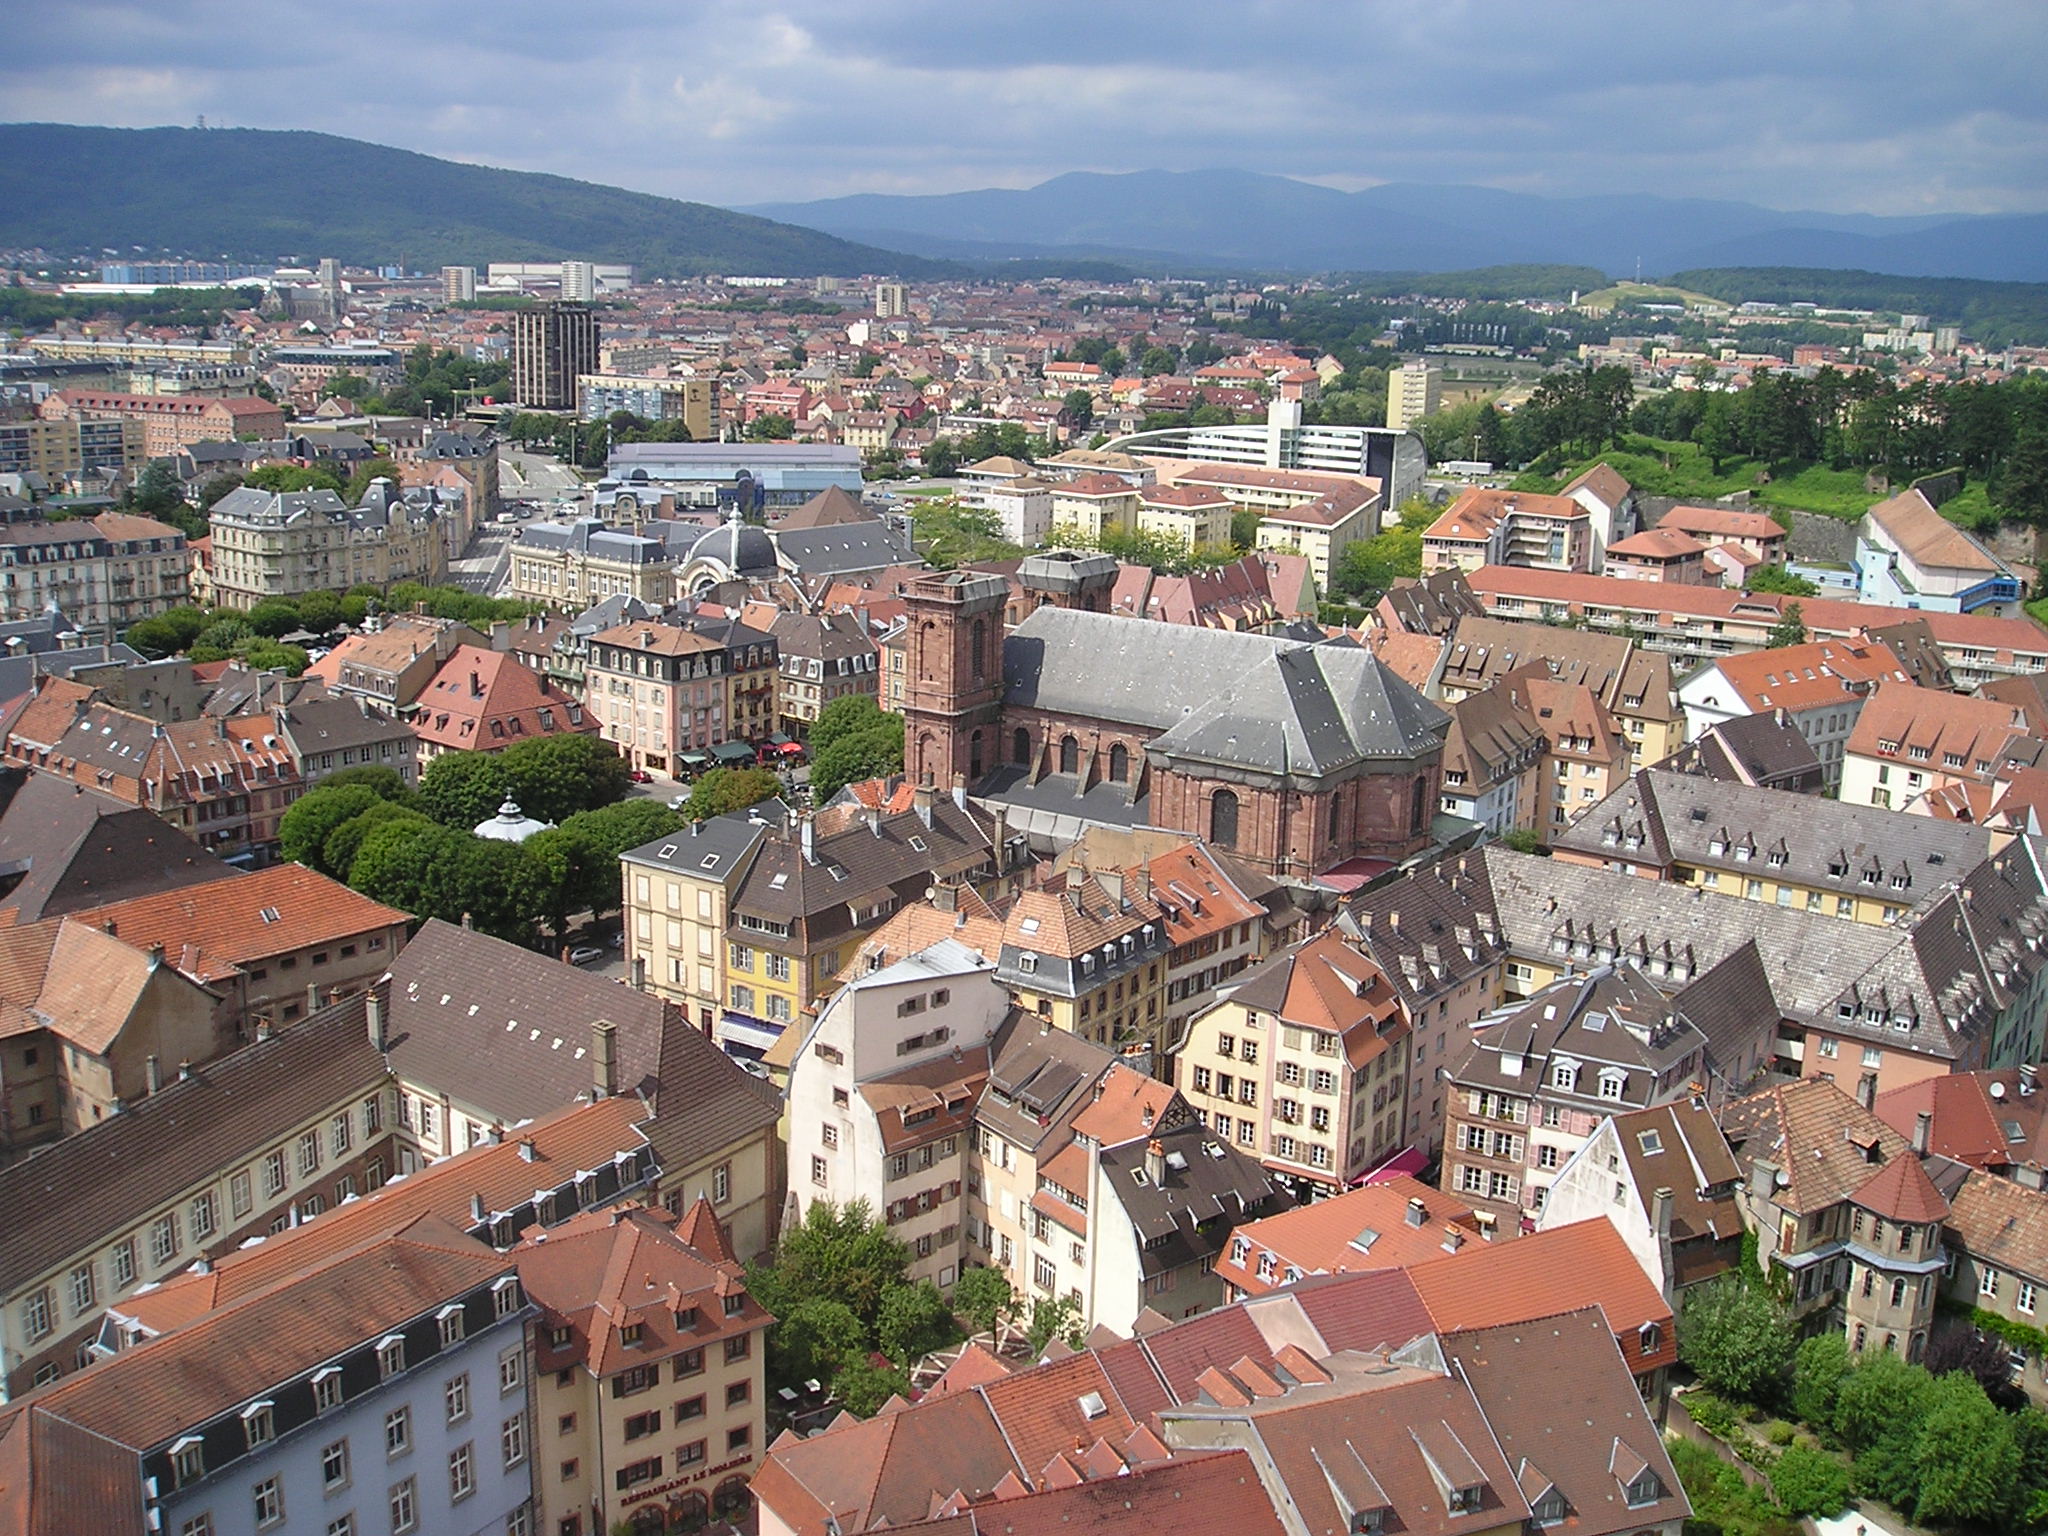
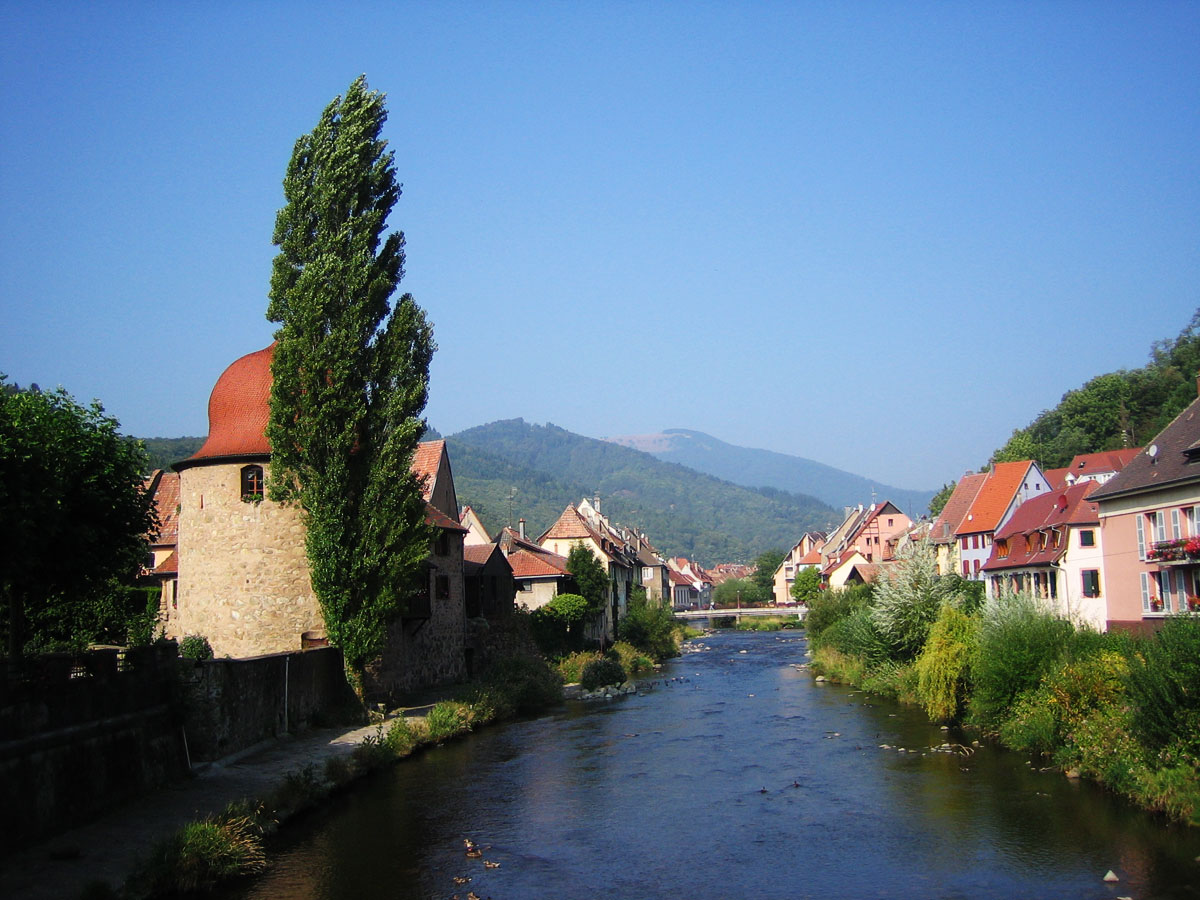
Sewen
Sewen is a commune in the Haut-Rhin department in Alsace-Champagne-Ardenne-Lorraine in north-eastern France.
Sewen Wikipedia Page

About Our Data
The data on this page is estimated using a number of publicly available tools and resources. It is provided without warranty, and could contain inaccuracies. Use at your own risk.