Categories in Hunsur
Industries
Business Distribution by Industry in Hunsur
| Industry Description | Number of Establishments |
|---|---|
| Shopping | 135 |
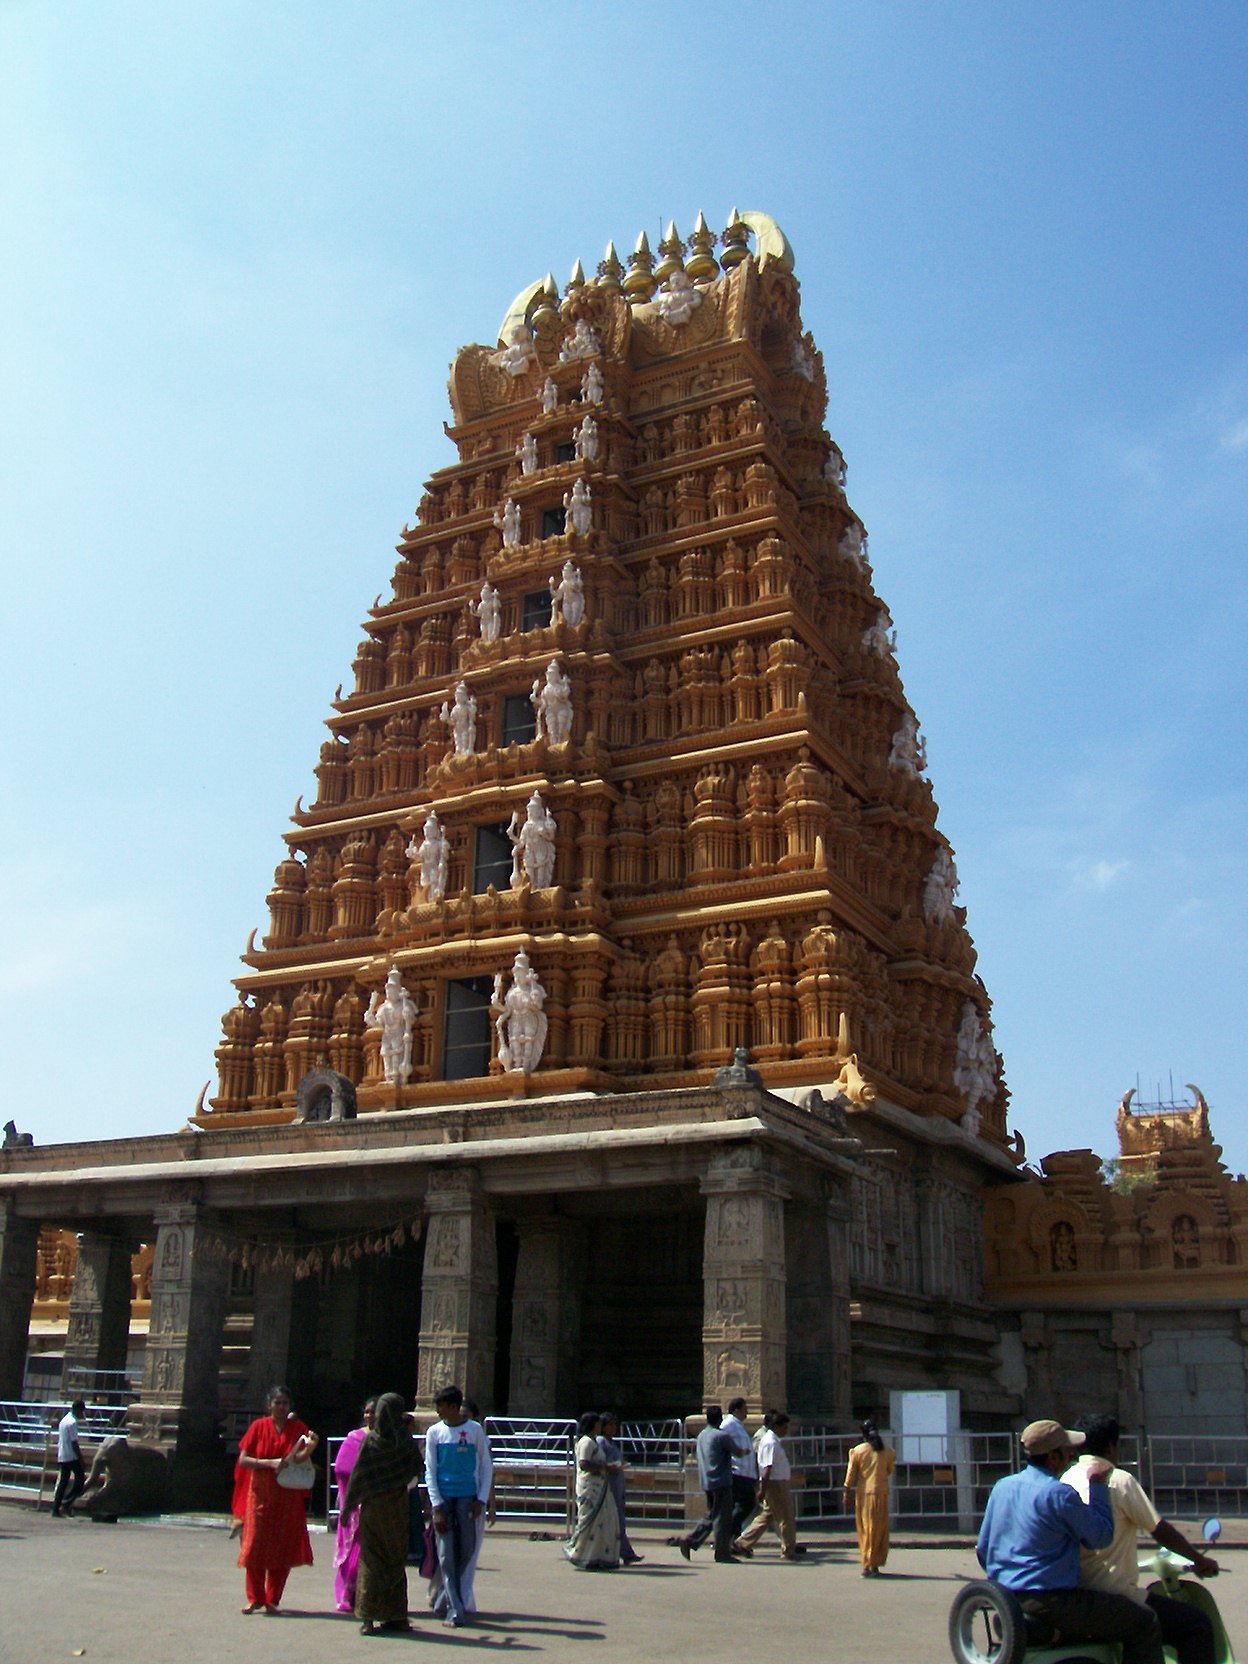
| Hindu temple | 89 |
| Education | 83 |
| Restaurants | 79 |
| Clothing stores | 54 |
| Electronics stores | 52 |
| Public administration | 39 |
| Grocery stores and supermarkets | 38 |
| Shopping other | 38 |
| Hardware store | 36 |
Hunsur Facts
| Area | 3.1 km² |
| Population | 1,735 |
| Male Population | 876 (50.5%) |
| Female Population | 859 (49.5%) |
| Population change (2000 to 2020) | +504.5% |
| Median Age | 28.6 years (Male: 28.5, Female: 28.7) |
| Area Codes | 8222 |
| Neighborhoods | Muthumariyamman Kovil, Naubasta, Bmbypasroad, Veeranahosalli, Maruthi Extension |
| Local Time | |
| Timezone | India Standard Time |
| Lat & Lng | 12.30359, 76.29275 |
| Pin Codes | 571106, 571134 |
Map of Hunsur
Interactive Map
Hunsur Population
Years 1975 to 2020
| Data | 1975 | 1990 | 2000 | 2015 | 2020 |
|---|---|---|---|---|---|
| Population | 0 | 0 | 287 | 1,644 | 1,735 |
| Population Density | 0 / km² | 0 / km² | 91.8 / km² | 526.1 / km² | 555.2 / km² |
Hunsur Population change from 2000 to 2015
Increase of 472.8% from year 2000 to 2015
| Location | Change since 1975 | Change since 1990 | Change since 2000 |
|---|---|---|---|
| Hunsur | — | — | +472.8% |
| Karnataka | +93% | +43.6% | +21.3% |
| India | +111.1% | +50.6% | +24.5% |
Hunsur Median Age
Median Age: 28.6 years
| Location | Median Age | Median Age (Female) | Median Age (Male) |
|---|---|---|---|
| Hunsur | 28.6 yrs | 28.7 yrs | 28.5 yrs |
| Karnataka | 27.3 yrs | 27.7 yrs | 26.9 yrs |
| India | 24.9 yrs | 25.4 yrs | 24.5 yrs |
Hunsur Population Density
Population Density: 555 / km²
| Location | Population | Area | Density |
|---|---|---|---|
| Hunsur | 1,735 | 3.125 km² | 555 / km² |
| Karnataka | 65.4 million | 191,736.8 km² | 341 / km² |
| India | 1,307 million | 3,083,563.4 km² | 424 / km² |
Hunsur Historical and Projected Population
Estimated Population from 0 to 2100
- JRC (European Commission's Joint Research Centre) work on the GHS built-up grid
- CIESIN (Center for International Earth Science Information Network)
- [Link] Klein Goldewijk, K., Beusen, A., Doelman, J., and Stehfest, E.: Anthropogenic land use estimates for the Holocene – HYDE 3.2, Earth Syst. Sci. Data, 9, 927–953, https://doi.org/10.5194/essd-9-927-2017, 2017.
Area Codes
Percentage Area Codes used by businesses in Hunsur
Price Distribution
Business distribution by price for Hunsur
Human Development Index (HDI)
Statistic composite index of life expectancy, education, and per capita income.
Hunsur CO2 Emissions
Carbon Dioxide (CO2) Emissions Per Capita in Tonnes Per Year
| Location | CO2 Emissions | CO2 Emissions Per Capita | CO2 Emissions Intensity |
|---|---|---|---|
| Hunsur | 3,005 tn | 1.73 tn | 961.7 tons/km² |
| Karnataka | 96,165,493 tn | 1.47 tn | 501.5 tons/km² |
| India | 1,928,568,344 tn | 1.48 tn | 625.4 tons/km² |
| 2013 CO2 emissions (tonnes/year) | 3,005 tn |
| 2013 CO2 emissions (tonnes/year) per capita | 1.73 tn |
| 2013 CO2 emissions intensity (tonnes/km²/year) | 961.7 tons/km² |
Hunsur
Hunsur is a taluk in Mysore district in the Indian state of Karnataka. main claim to fame was that former Chief minister of Karnataka state Sri D. Devaraj Urs Called as God for Hunsur Taluk Farmers hailed from this constituency of the Karnataka Legi..
Hunsur Wikipedia Page

About Our Data
The data on this page is estimated using a number of publicly available tools and resources. It is provided without warranty, and could contain inaccuracies. Use at your own risk.