Industries
Business Distribution by Industry in Tetipac
Tetipac Facts
| Area | 1.1 km² |
| Population | 2,261 |
| Male Population | 1,078 (47.7%) |
| Female Population | 1,183 (52.3%) |
| Population change (1975 to 2020) | +62.0% |
| Population change (2000 to 2020) | +10.0% |
| Median Age | 24.7 years (Male: 23.5, Female: 25.5) |
| Area Codes | 467 |
| Local Time | |
| Timezone | Central Standard Time |
| Lat & Lng | 18.64778, -99.64778 |
| Postal Codes | 40360, 40362, 40363, 40364, 40370, More |
Map of Tetipac
Interactive Map
Tetipac Population
Years 1975 to 2020
| Data | 1975 | 1990 | 2000 | 2015 | 2020 |
|---|---|---|---|---|---|
| Population | 1,396 | 1,836 | 2,056 | 2,168 | 2,261 |
| Population Density | 1,313.9 / km² | 1,728 / km² | 1,935.1 / km² | 2,040.5 / km² | 2,128 / km² |
Tetipac Population change from 2000 to 2015
Increase of 5.4% from year 2000 to 2015
| Location | Change since 1975 | Change since 1990 | Change since 2000 |
|---|---|---|---|
| Tetipac | +55.3% | +18.1% | +5.4% |
| Guerrero | +125.1% | +51.1% | +23% |
| Mexico | +108.7% | +48.4% | +23.5% |
Tetipac Median Age
Median Age: 24.7 years
| Location | Median Age | Median Age (Female) | Median Age (Male) |
|---|---|---|---|
| Tetipac | 24.7 yrs | 25.5 yrs | 23.5 yrs |
| Guerrero | 23.2 yrs | 24.1 yrs | 22.3 yrs |
| Mexico | 26.2 yrs | 27 yrs | 25.3 yrs |
Tetipac Population Density
Population Density: 2,128 / km²
| Location | Population | Area | Density |
|---|---|---|---|
| Tetipac | 2,261 | 1.063 km² | 2,128 / km² |
| Guerrero | 3.8 million | 63,596.7 km² | 59.3 / km² |
| Mexico | 126.8 million | 1,965,208 km² | 64.5 / km² |
Tetipac Historical and Projected Population
Estimated Population from 0 to 2100
- JRC (European Commission's Joint Research Centre) work on the GHS built-up grid
- CIESIN (Center for International Earth Science Information Network)
- [Link] Klein Goldewijk, K., Beusen, A., Doelman, J., and Stehfest, E.: Anthropogenic land use estimates for the Holocene – HYDE 3.2, Earth Syst. Sci. Data, 9, 927–953, https://doi.org/10.5194/essd-9-927-2017, 2017.
Human Development Index (HDI)
Statistic composite index of life expectancy, education, and per capita income.
Tetipac CO2 Emissions
Carbon Dioxide (CO2) Emissions Per Capita in Tonnes Per Year
| Location | CO2 Emissions | CO2 Emissions Per Capita | CO2 Emissions Intensity |
|---|---|---|---|
| Tetipac | 7,398 tn | 3.27 tn | 6,962.9 tons/km² |
| Guerrero | 12,480,202 tn | 3.31 tn | 196.2 tons/km² |
| Mexico | 496,865,013 tn | 3.92 tn | 252.8 tons/km² |
| 2013 CO2 emissions (tonnes/year) | 7,398 tn |
| 2013 CO2 emissions (tonnes/year) per capita | 3.27 tn |
| 2013 CO2 emissions intensity (tonnes/km²/year) | 6,962.9 tons/km² |
Natural Hazards Risk
Relative risk out of 10
| Hazard | Risk Level |
|---|---|
| Drought | Medium (4) |
| Flood | High (8) |
| Earthquake | Medium (6) |
| Landslide | Medium (6) |
* Risk, particularly concerning flood or landslide, may not be for the entire area.
- Dilley, M., R.S. Chen, U. Deichmann, A.L. Lerner-Lam, M. Arnold, J. Agwe, P. Buys, O. Kjekstad, B. Lyon, and G. Yetman. 2005. Natural Disaster Hotspots: A Global Risk Analysis. Washington, D.C.: World Bank. https://doi.org/10.1596/0-8213-5930-4.
- Center for Hazards and Risk Research - CHRR - Columbia University, Center for International Earth Science Information Network - CIESIN - Columbia University, and Norwegian Geotechnical Institute - NGI. 2005. Global Landslide Hazard Distribution. Palisades, NY: NASA Socioeconomic Data and Applications Center (SEDAC). https://doi.org/10.7927/H4P848VZ.
- Center for Hazards and Risk Research - CHRR - Columbia University, Center for International Earth Science Information Network - CIESIN - Columbia University, and International Research Institute for Climate and Society - IRI - Columbia University. 2005. Global Drought Hazard Frequency and Distribution. Palisades, NY: NASA Socioeconomic Data and Applications Center (SEDAC). https://doi.org/10.7927/H4VX0DFT.
- Center for Hazards and Risk Research - CHRR - Columbia University, Center for International Earth Science Information Network - CIESIN - Columbia University. 2005. Global Flood Hazard Frequency and Distribution. Palisades, NY: NASA Socioeconomic Data and Applications Center (SEDAC). https://doi.org/10.7927/H4668B3D.
- Center for Hazards and Risk Research - CHRR - Columbia University, Center for International Earth Science Information Network - CIESIN - Columbia University. 2005. Global Earthquake Hazard Distribution - Peak Ground Acceleration. Palisades, NY: NASA Socioeconomic Data and Applications Center (SEDAC). https://doi.org/10.7927/H4BZ63ZS.
Recent Nearby Earthquakes
Magnitude 3.0 and greater
| Date▼ | Time↕ | Magnitude↕ | Distance↕ | Depth↕ | Location↕ | Link |
|---|---|---|---|---|---|---|
| 8/28/15 | 1:56 AM | 4 | 58.8 km | 51,700 m | 17km S of Tepecoacuilco de Trujano, Mexico | usgs.gov |
| 12/27/14 | 1:33 PM | 4 | 34.3 km | 55,600 m | 5km N of Teloloapan, Mexico | usgs.gov |
| 1/7/14 | 6:09 AM | 4.2 | 67.9 km | 49,900 m | 12km SSE of Apaxtla de Castrejon, Mexico | usgs.gov |
| 6/29/13 | 9:19 PM | 4.5 | 67.3 km | 55,100 m | 14km NNW of Copalillo, Mexico | usgs.gov |
| 6/18/13 | 4:33 PM | 4 | 76.1 km | 52,700 m | Guerrero, Mexico | usgs.gov |
| 6/16/13 | 5:19 AM | 5.8 | 72 km | 52,000 m | 15km NW of Copalillo, Mexico | usgs.gov |
| 2/23/13 | 11:44 AM | 4.1 | 60.5 km | 38,000 m | 14km S of Huitzuco de los Figueroa, Mexico | usgs.gov |
| 1/26/13 | 11:14 AM | 4.1 | 61.8 km | 51,700 m | 17km SSE of Cocula, Mexico | usgs.gov |
| 7/17/12 | 3:57 PM | 4.1 | 29.5 km | 75,700 m | Guerrero, Mexico | usgs.gov |
| 4/27/12 | 11:42 PM | 4 | 64.2 km | 52,100 m | Guerrero, Mexico | usgs.gov |
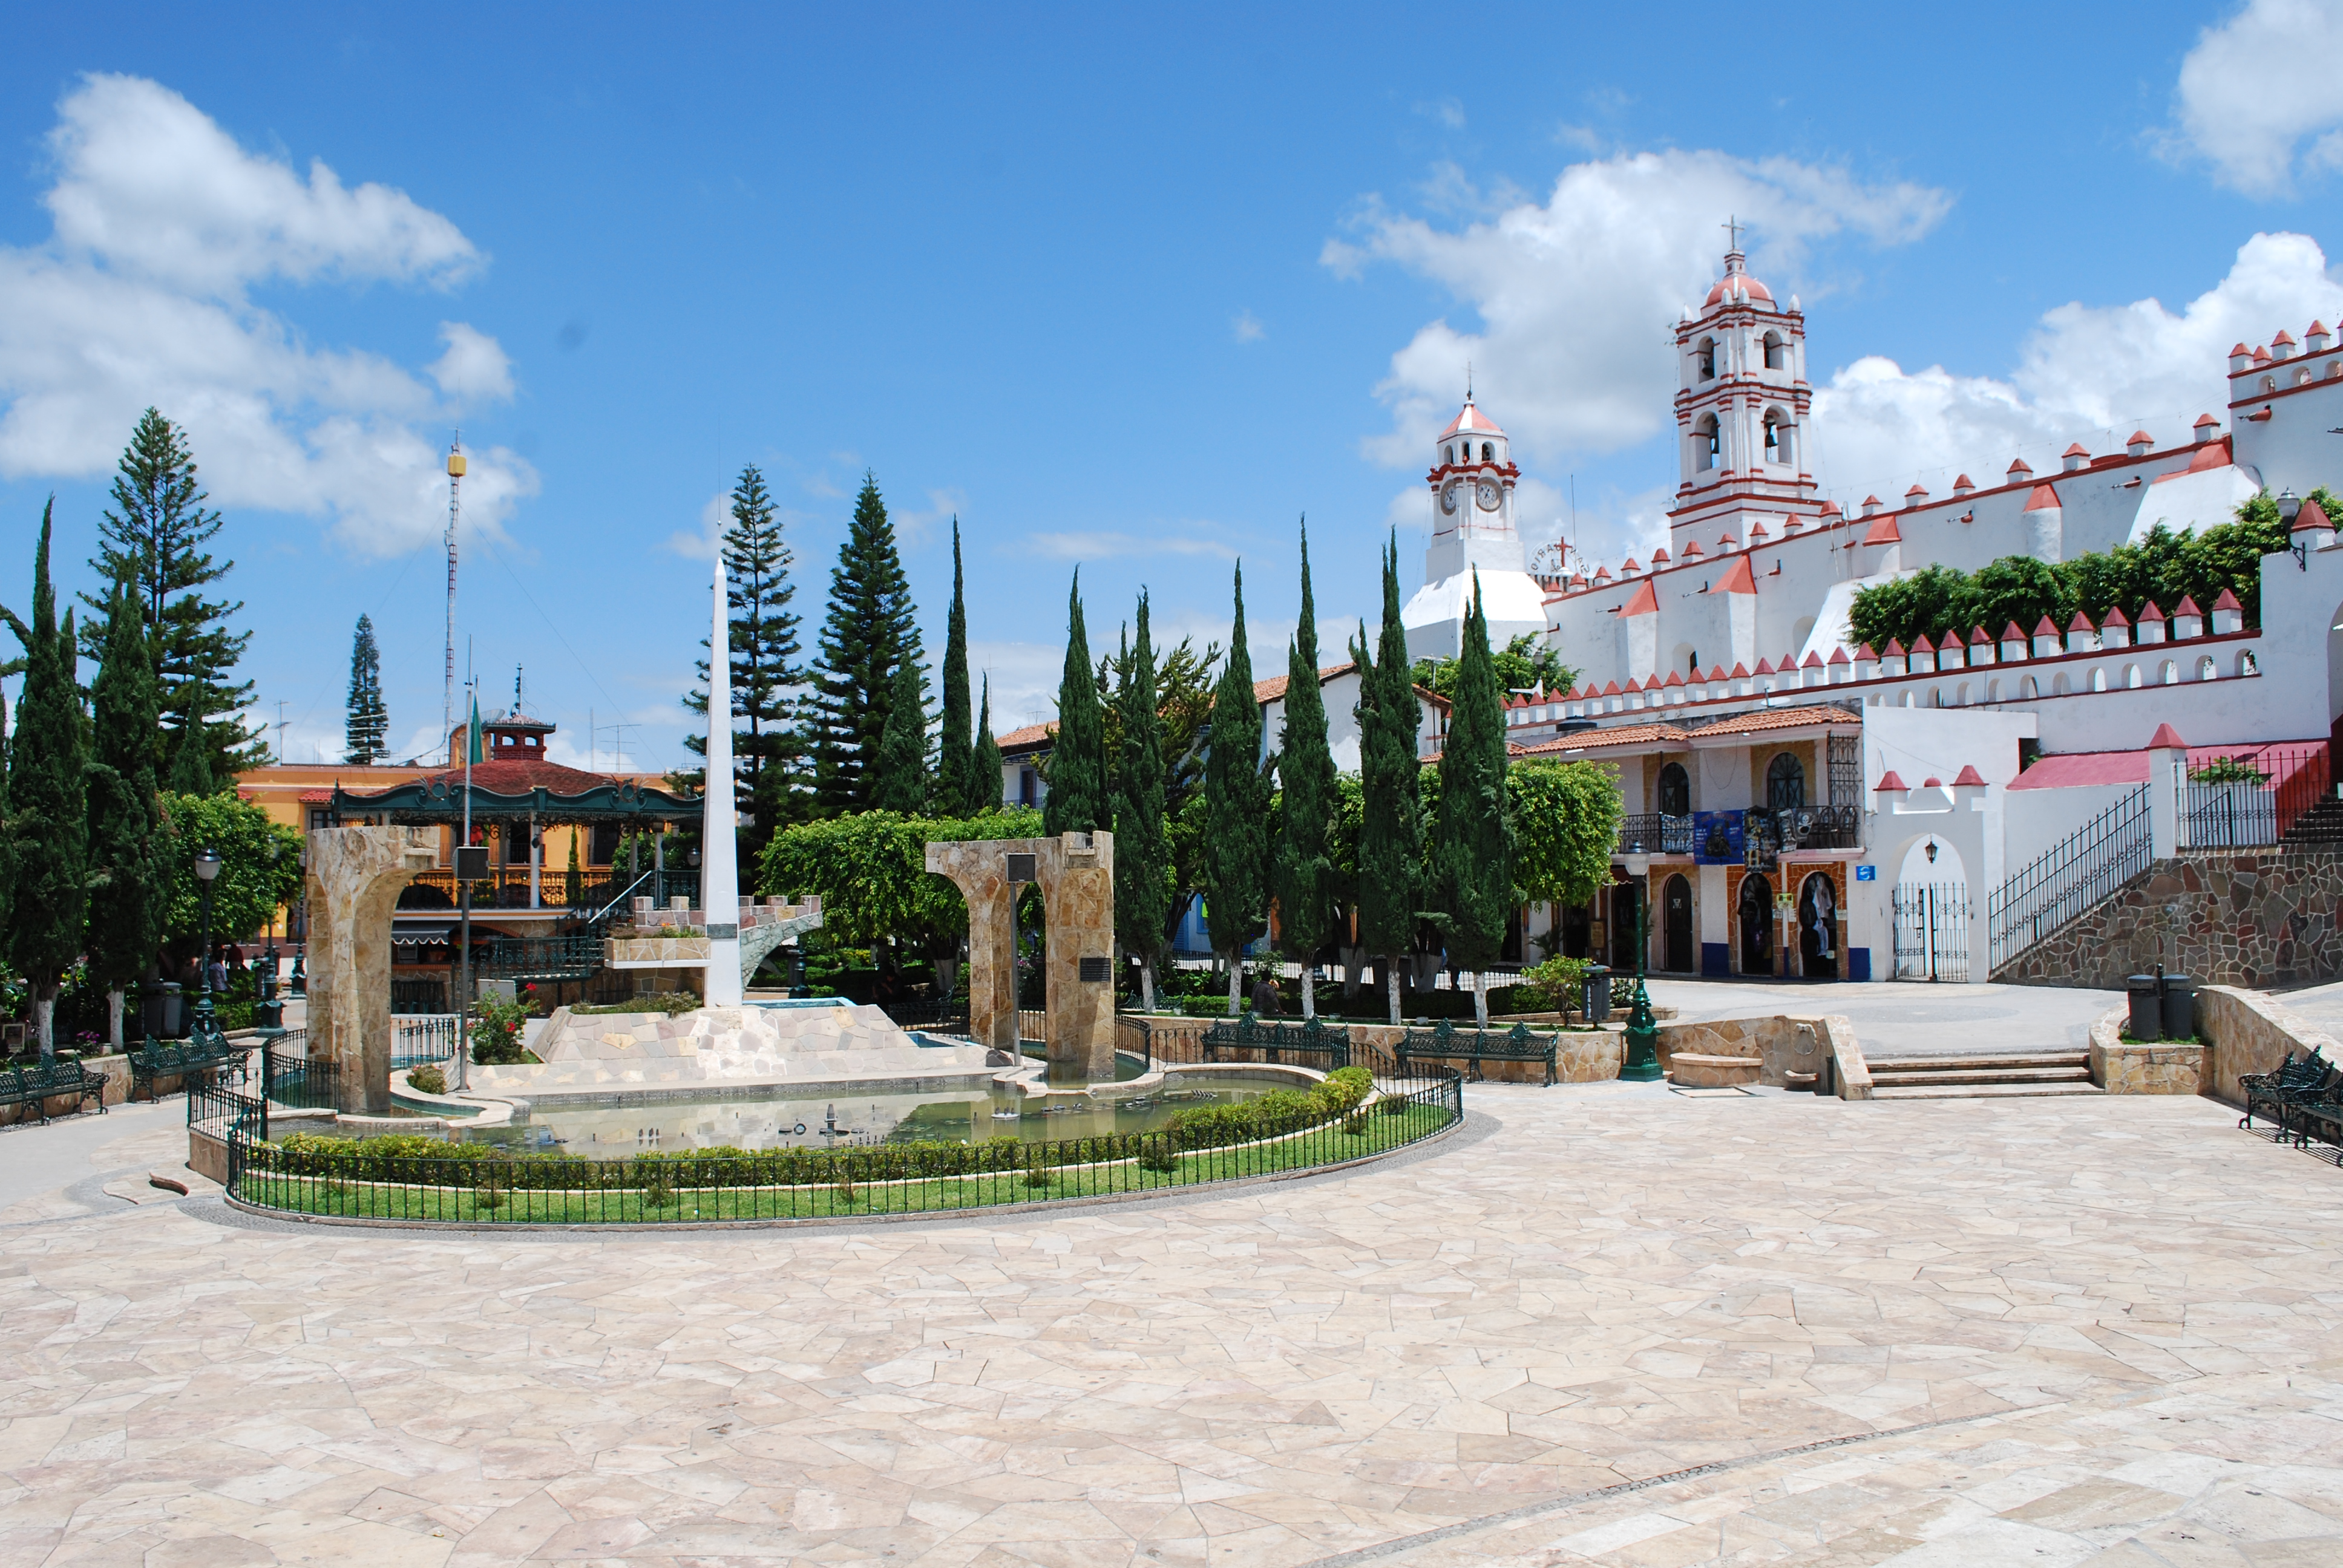
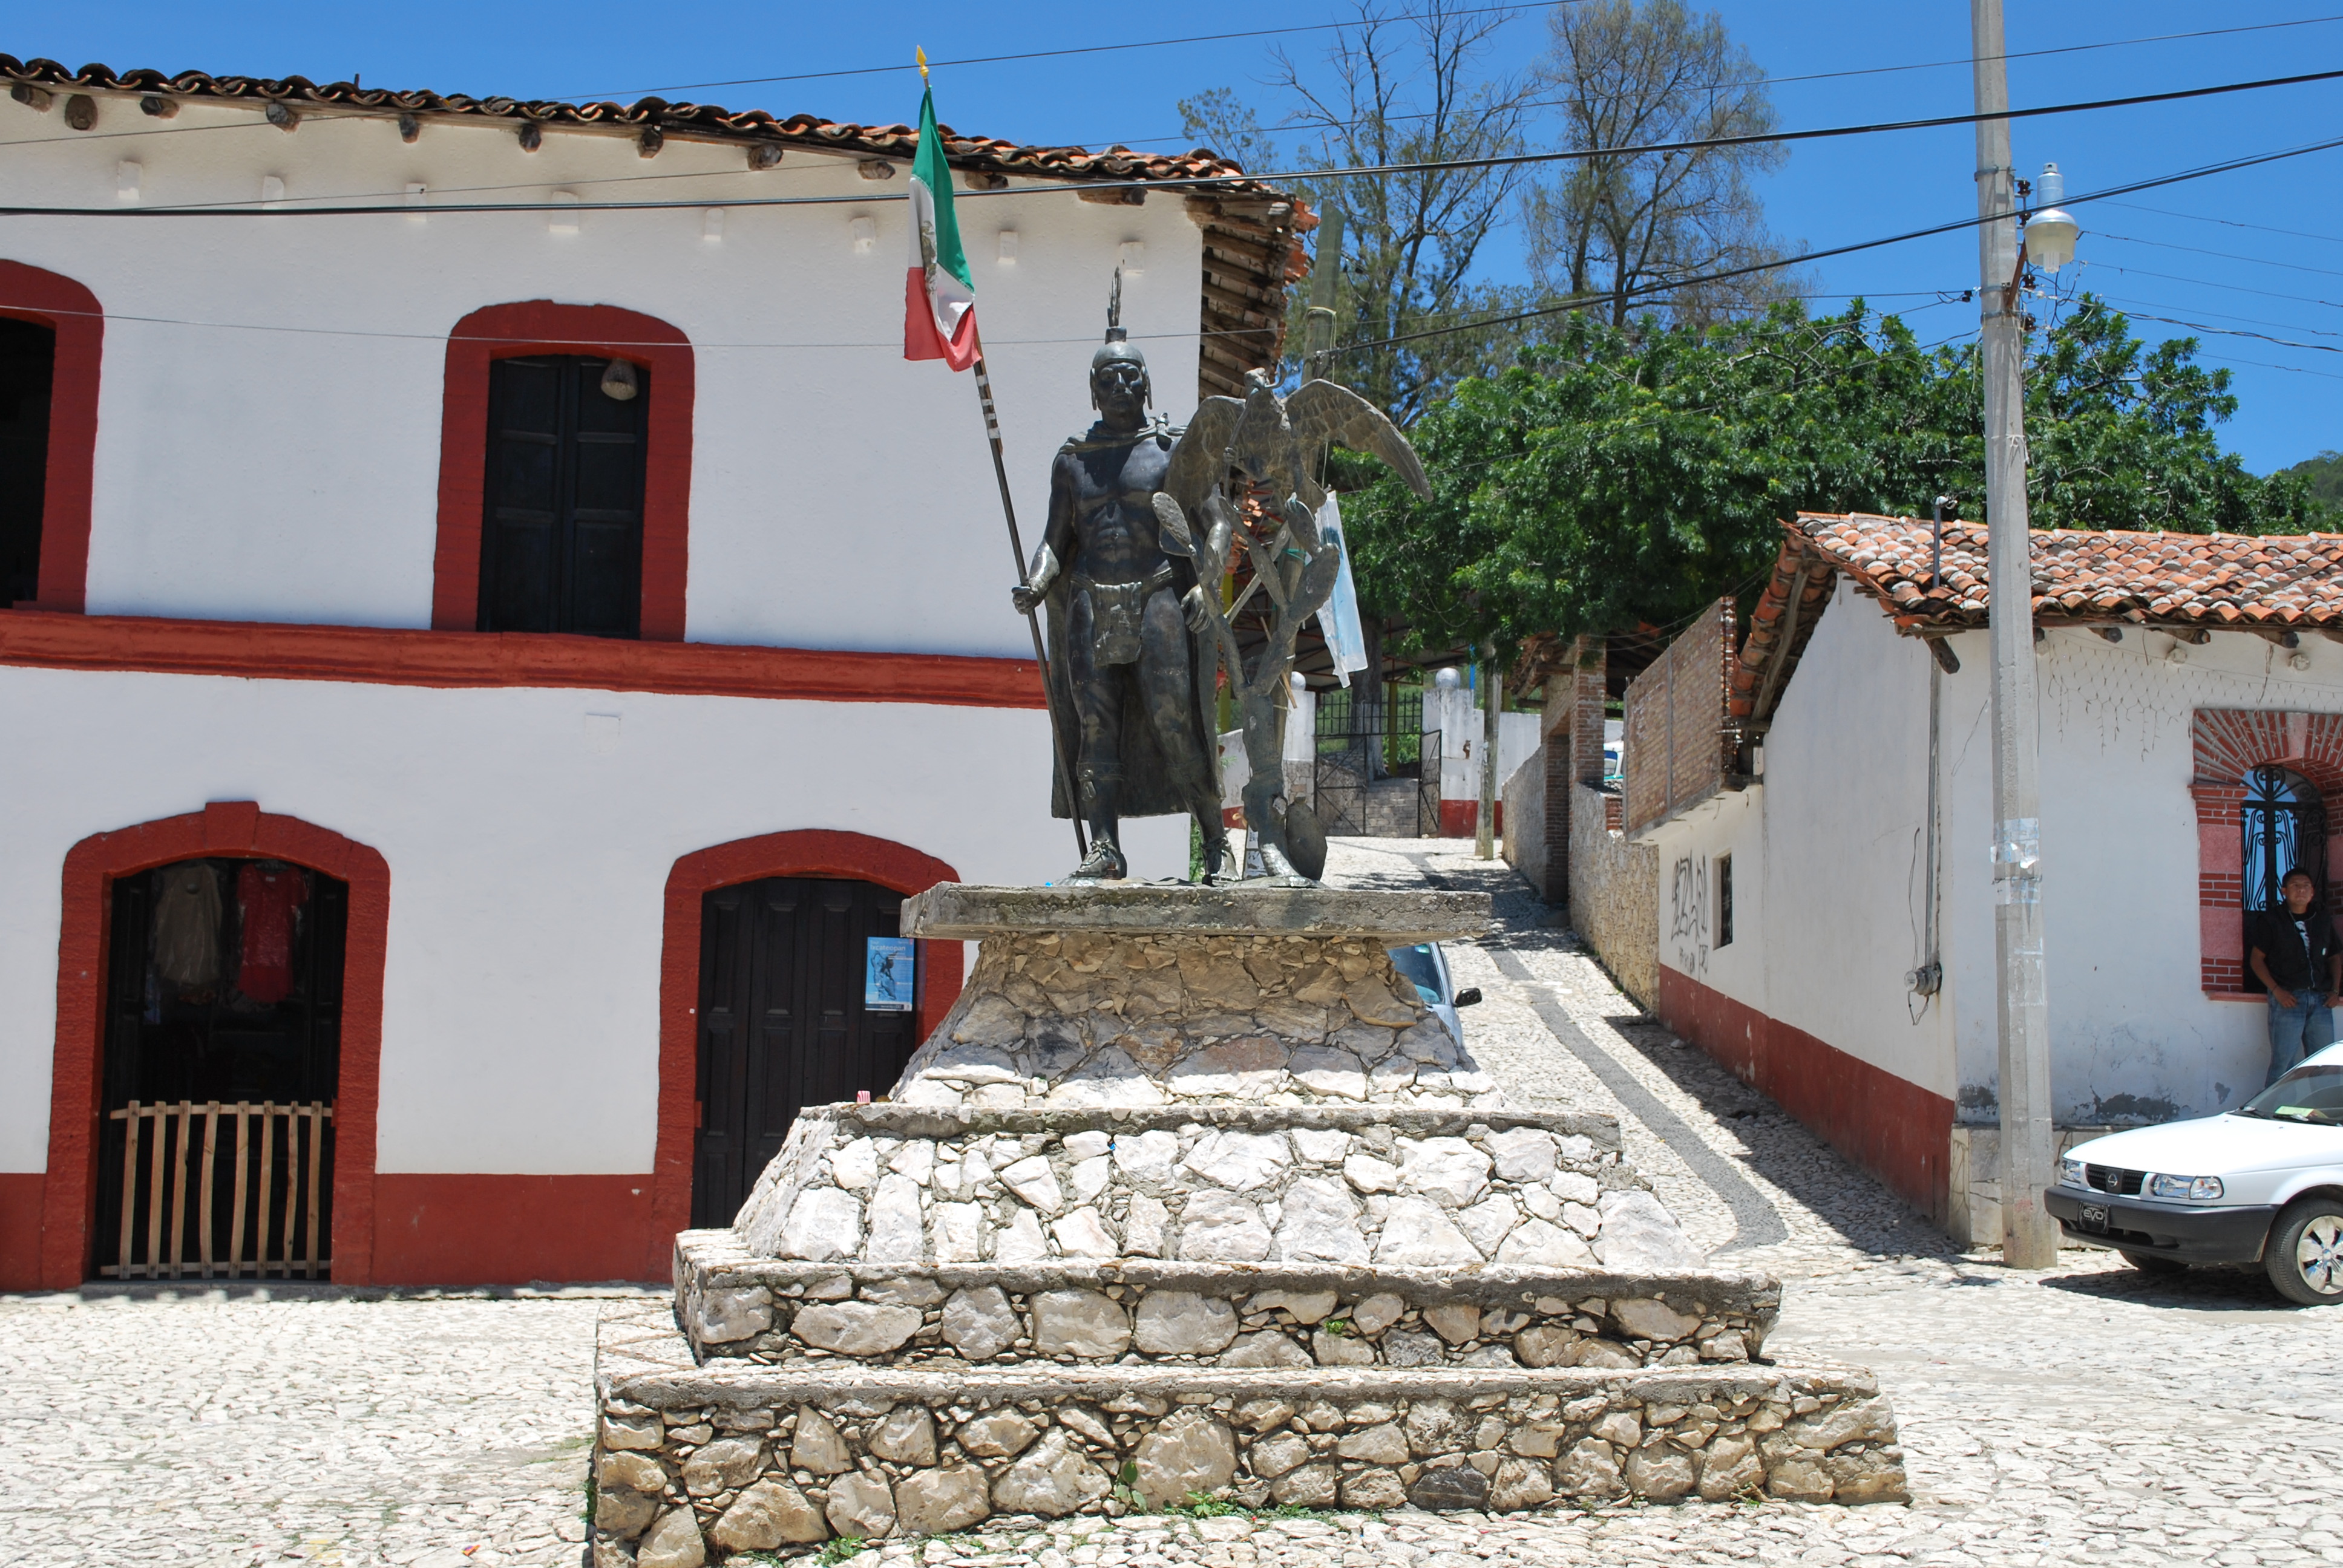
Tetipac
Tetipac is a city and seat of the municipality of Tetipac, in the state of Guerrero, south-western Mexico.
Tetipac Wikipedia Page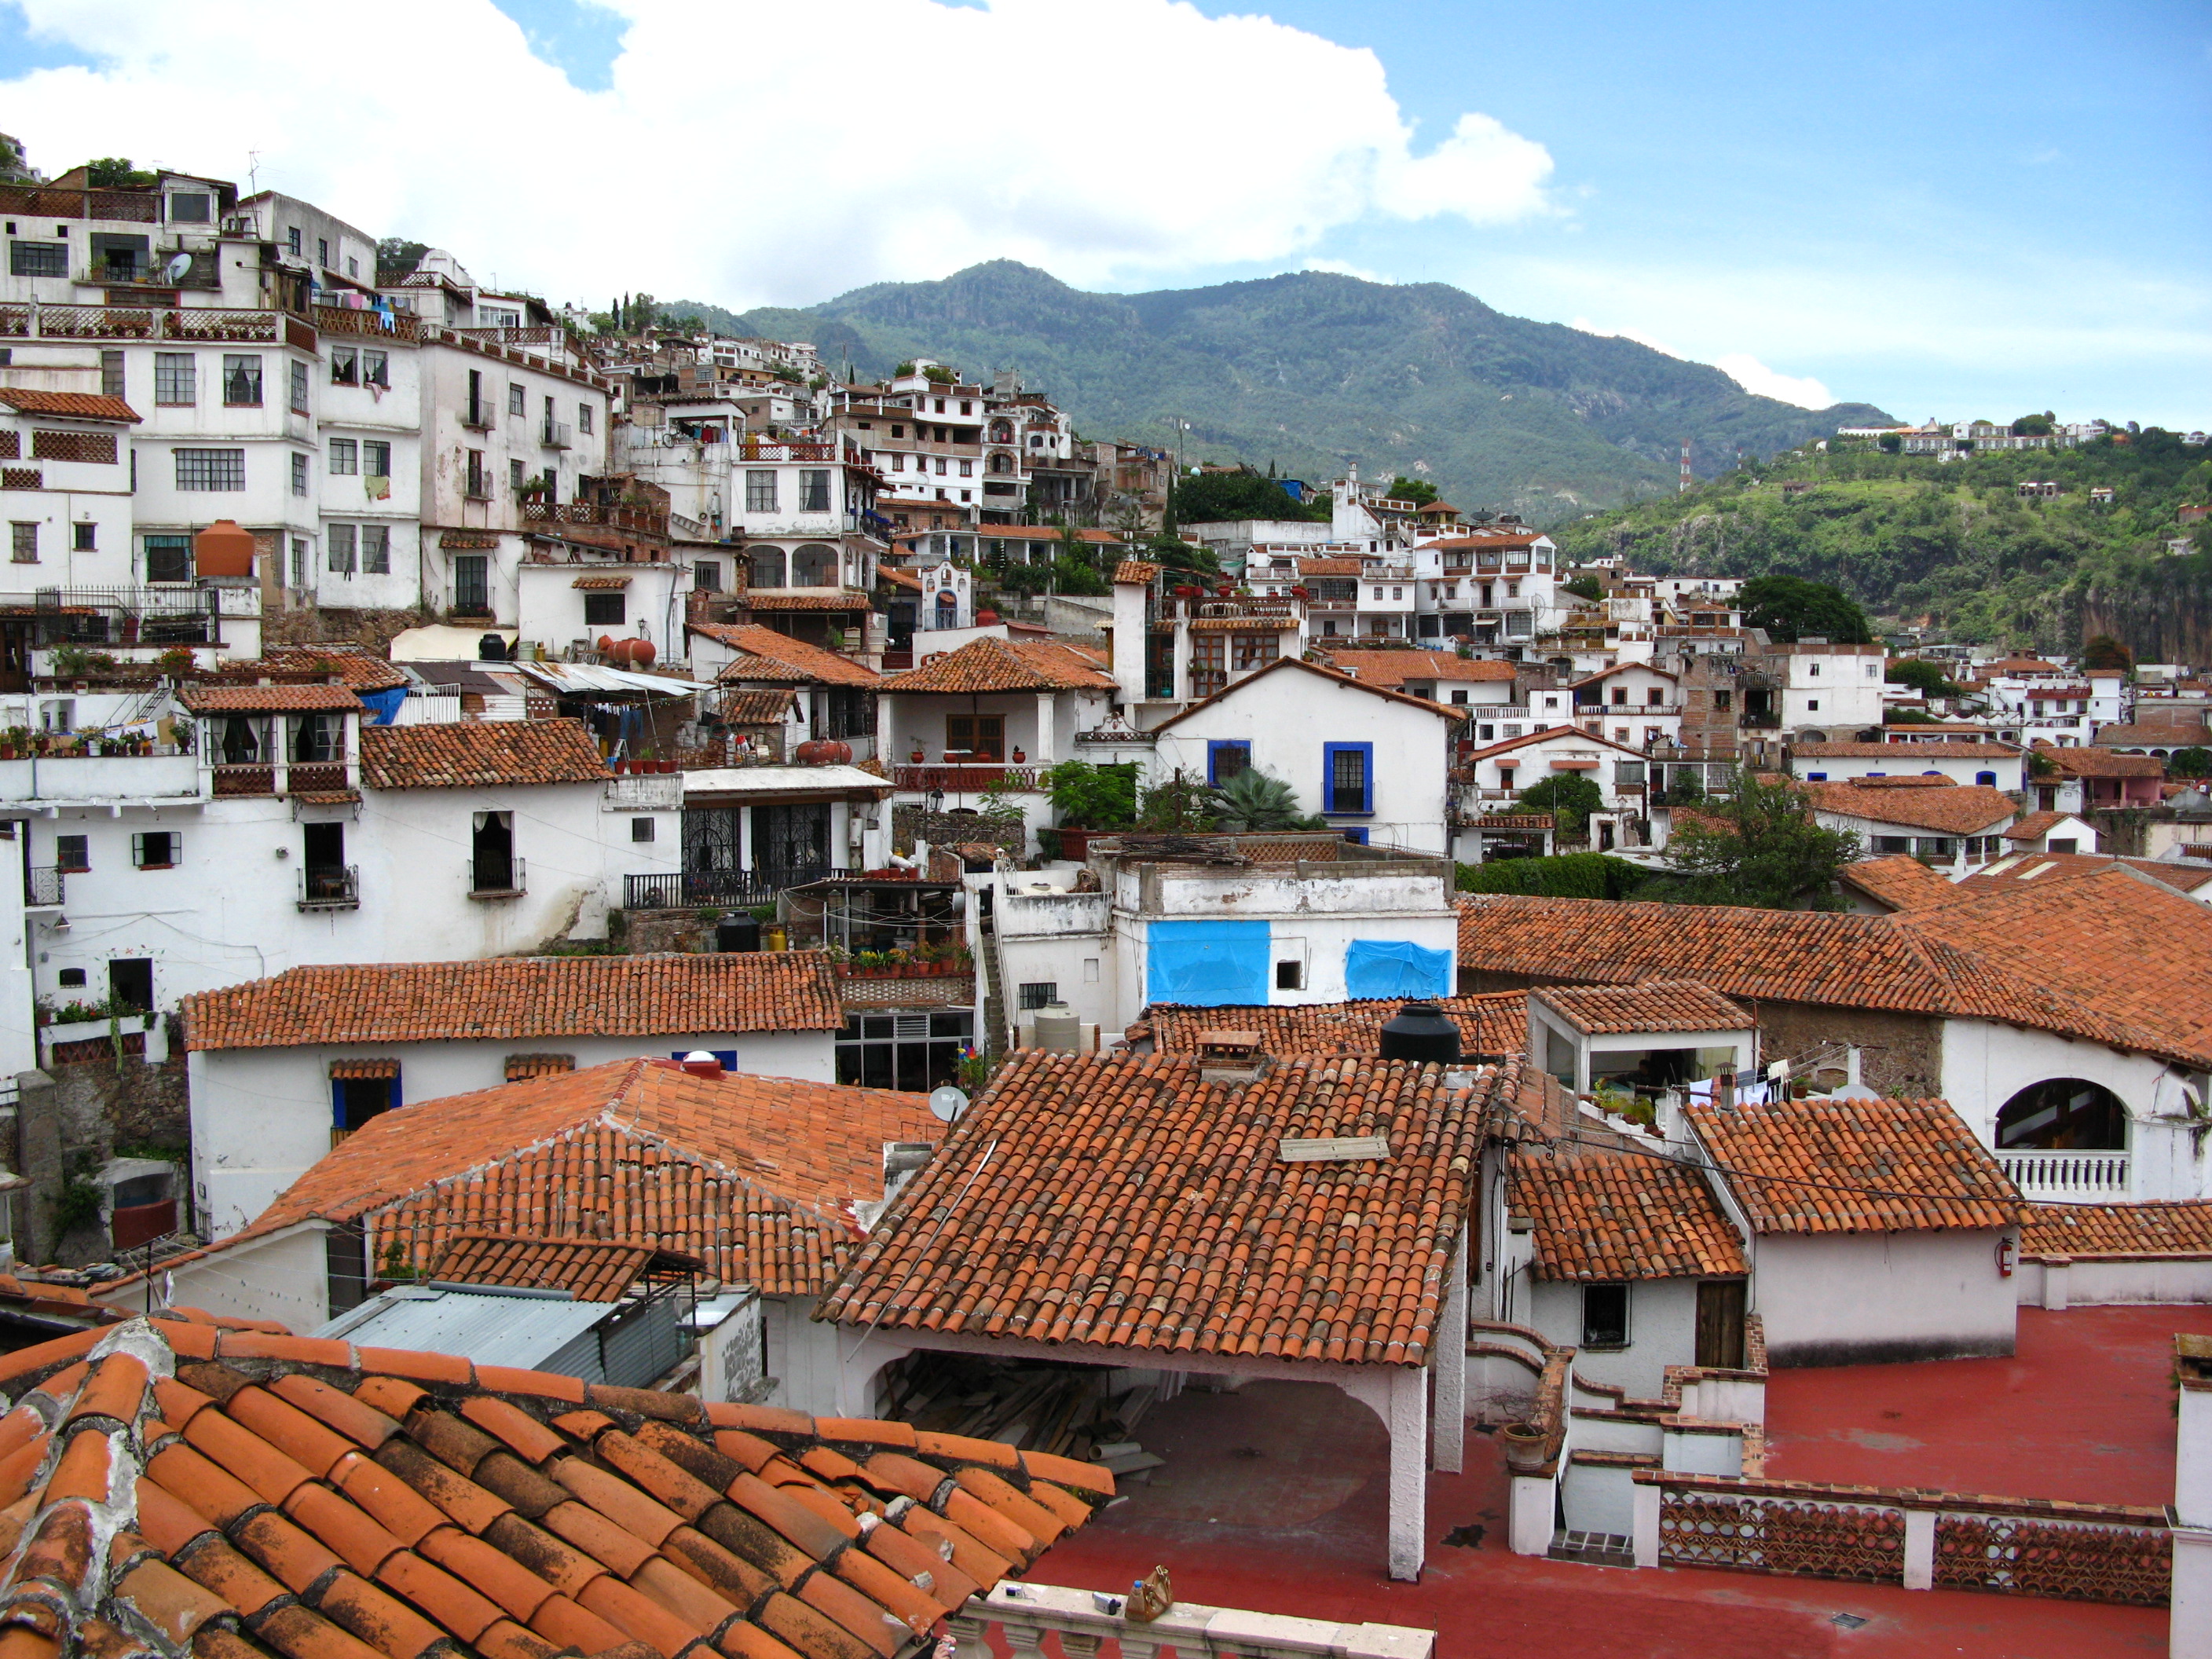
About Our Data
The data on this page is estimated using a number of publicly available tools and resources. It is provided without warranty, and could contain inaccuracies. Use at your own risk.