Outapi Facts
| Area | 2.5 km² |
| Population | 3,510 |
| Male Population | 1,581 (45.0%) |
| Female Population | 1,929 (55.0%) |
| Population change (1975 to 2020) | +261.5% |
| Population change (2000 to 2020) | +42.4% |
| Median Age | 18.5 years (Male: 17, Female: 19.8) |
| Local Time | |
| Timezone | Central Africa Time |
| Lat & Lng | -17.50000, 14.98333 |
Map of Outapi
Interactive Map
Outapi Population
Years 1975 to 2020
| Data | 1975 | 1990 | 2000 | 2015 | 2020 |
|---|---|---|---|---|---|
| Population | 971 | 1,738 | 2,465 | 3,255 | 3,510 |
| Population Density | 388.4 / km² | 695.2 / km² | 986 / km² | 1,302 / km² | 1,404 / km² |
Outapi Population change from 2000 to 2015
Increase of 32% from year 2000 to 2015
| Location | Change since 1975 | Change since 1990 | Change since 2000 |
|---|---|---|---|
| Outapi | +235.2% | +87.3% | +32% |
| Omusati Region | +125.3% | +48.4% | +16% |
| Namibia | +169.8% | +71.5% | +28.5% |
Outapi Median Age
Median Age: 18.5 years
| Location | Median Age | Median Age (Female) | Median Age (Male) |
|---|---|---|---|
| Outapi | 18.5 yrs | 19.8 yrs | 17 yrs |
| Omusati Region | 18.6 yrs | 20.6 yrs | 16.9 yrs |
| Namibia | 21.1 yrs | 21.7 yrs | 20.6 yrs |
Outapi Population Density
Population Density: 1,404 / km²
| Location | Population | Area | Density |
|---|---|---|---|
| Outapi | 3,510 | 2.5 km² | 1,404 / km² |
| Omusati Region | 272,543 | 26,599.3 km² | 10.2 / km² |
| Namibia | 2.5 million | 824,094.1 km² | 3 / km² |
Outapi Historical and Projected Population
Estimated Population from 1730 to 2100
- JRC (European Commission's Joint Research Centre) work on the GHS built-up grid
- CIESIN (Center for International Earth Science Information Network)
- [Link] Klein Goldewijk, K., Beusen, A., Doelman, J., and Stehfest, E.: Anthropogenic land use estimates for the Holocene – HYDE 3.2, Earth Syst. Sci. Data, 9, 927–953, https://doi.org/10.5194/essd-9-927-2017, 2017.
Human Development Index (HDI)
Statistic composite index of life expectancy, education, and per capita income.
Outapi CO2 Emissions
Carbon Dioxide (CO2) Emissions Per Capita in Tonnes Per Year
| Location | CO2 Emissions | CO2 Emissions Per Capita | CO2 Emissions Intensity |
|---|---|---|---|
| Outapi | 8,697 tn | 2.48 tn | 3,478.7 tons/km² |
| Omusati Region | 643,881 tn | 2.36 tn | 24.2 tons/km² |
| Namibia | 7,056,182 tn | 2.84 tn | 8.6 tons/km² |
| 2013 CO2 emissions (tonnes/year) | 8,697 tn |
| 2013 CO2 emissions (tonnes/year) per capita | 2.48 tn |
| 2013 CO2 emissions intensity (tonnes/km²/year) | 3,478.7 tons/km² |
Natural Hazards Risk
Relative risk out of 10
| Hazard | Risk Level |
|---|---|
| Drought | Medium (7) |
* Risk, particularly concerning flood or landslide, may not be for the entire area.
- Dilley, M., R.S. Chen, U. Deichmann, A.L. Lerner-Lam, M. Arnold, J. Agwe, P. Buys, O. Kjekstad, B. Lyon, and G. Yetman. 2005. Natural Disaster Hotspots: A Global Risk Analysis. Washington, D.C.: World Bank. https://doi.org/10.1596/0-8213-5930-4.
- Center for Hazards and Risk Research - CHRR - Columbia University, Center for International Earth Science Information Network - CIESIN - Columbia University, and International Research Institute for Climate and Society - IRI - Columbia University. 2005. Global Drought Hazard Frequency and Distribution. Palisades, NY: NASA Socioeconomic Data and Applications Center (SEDAC). https://doi.org/10.7927/H4VX0DFT.
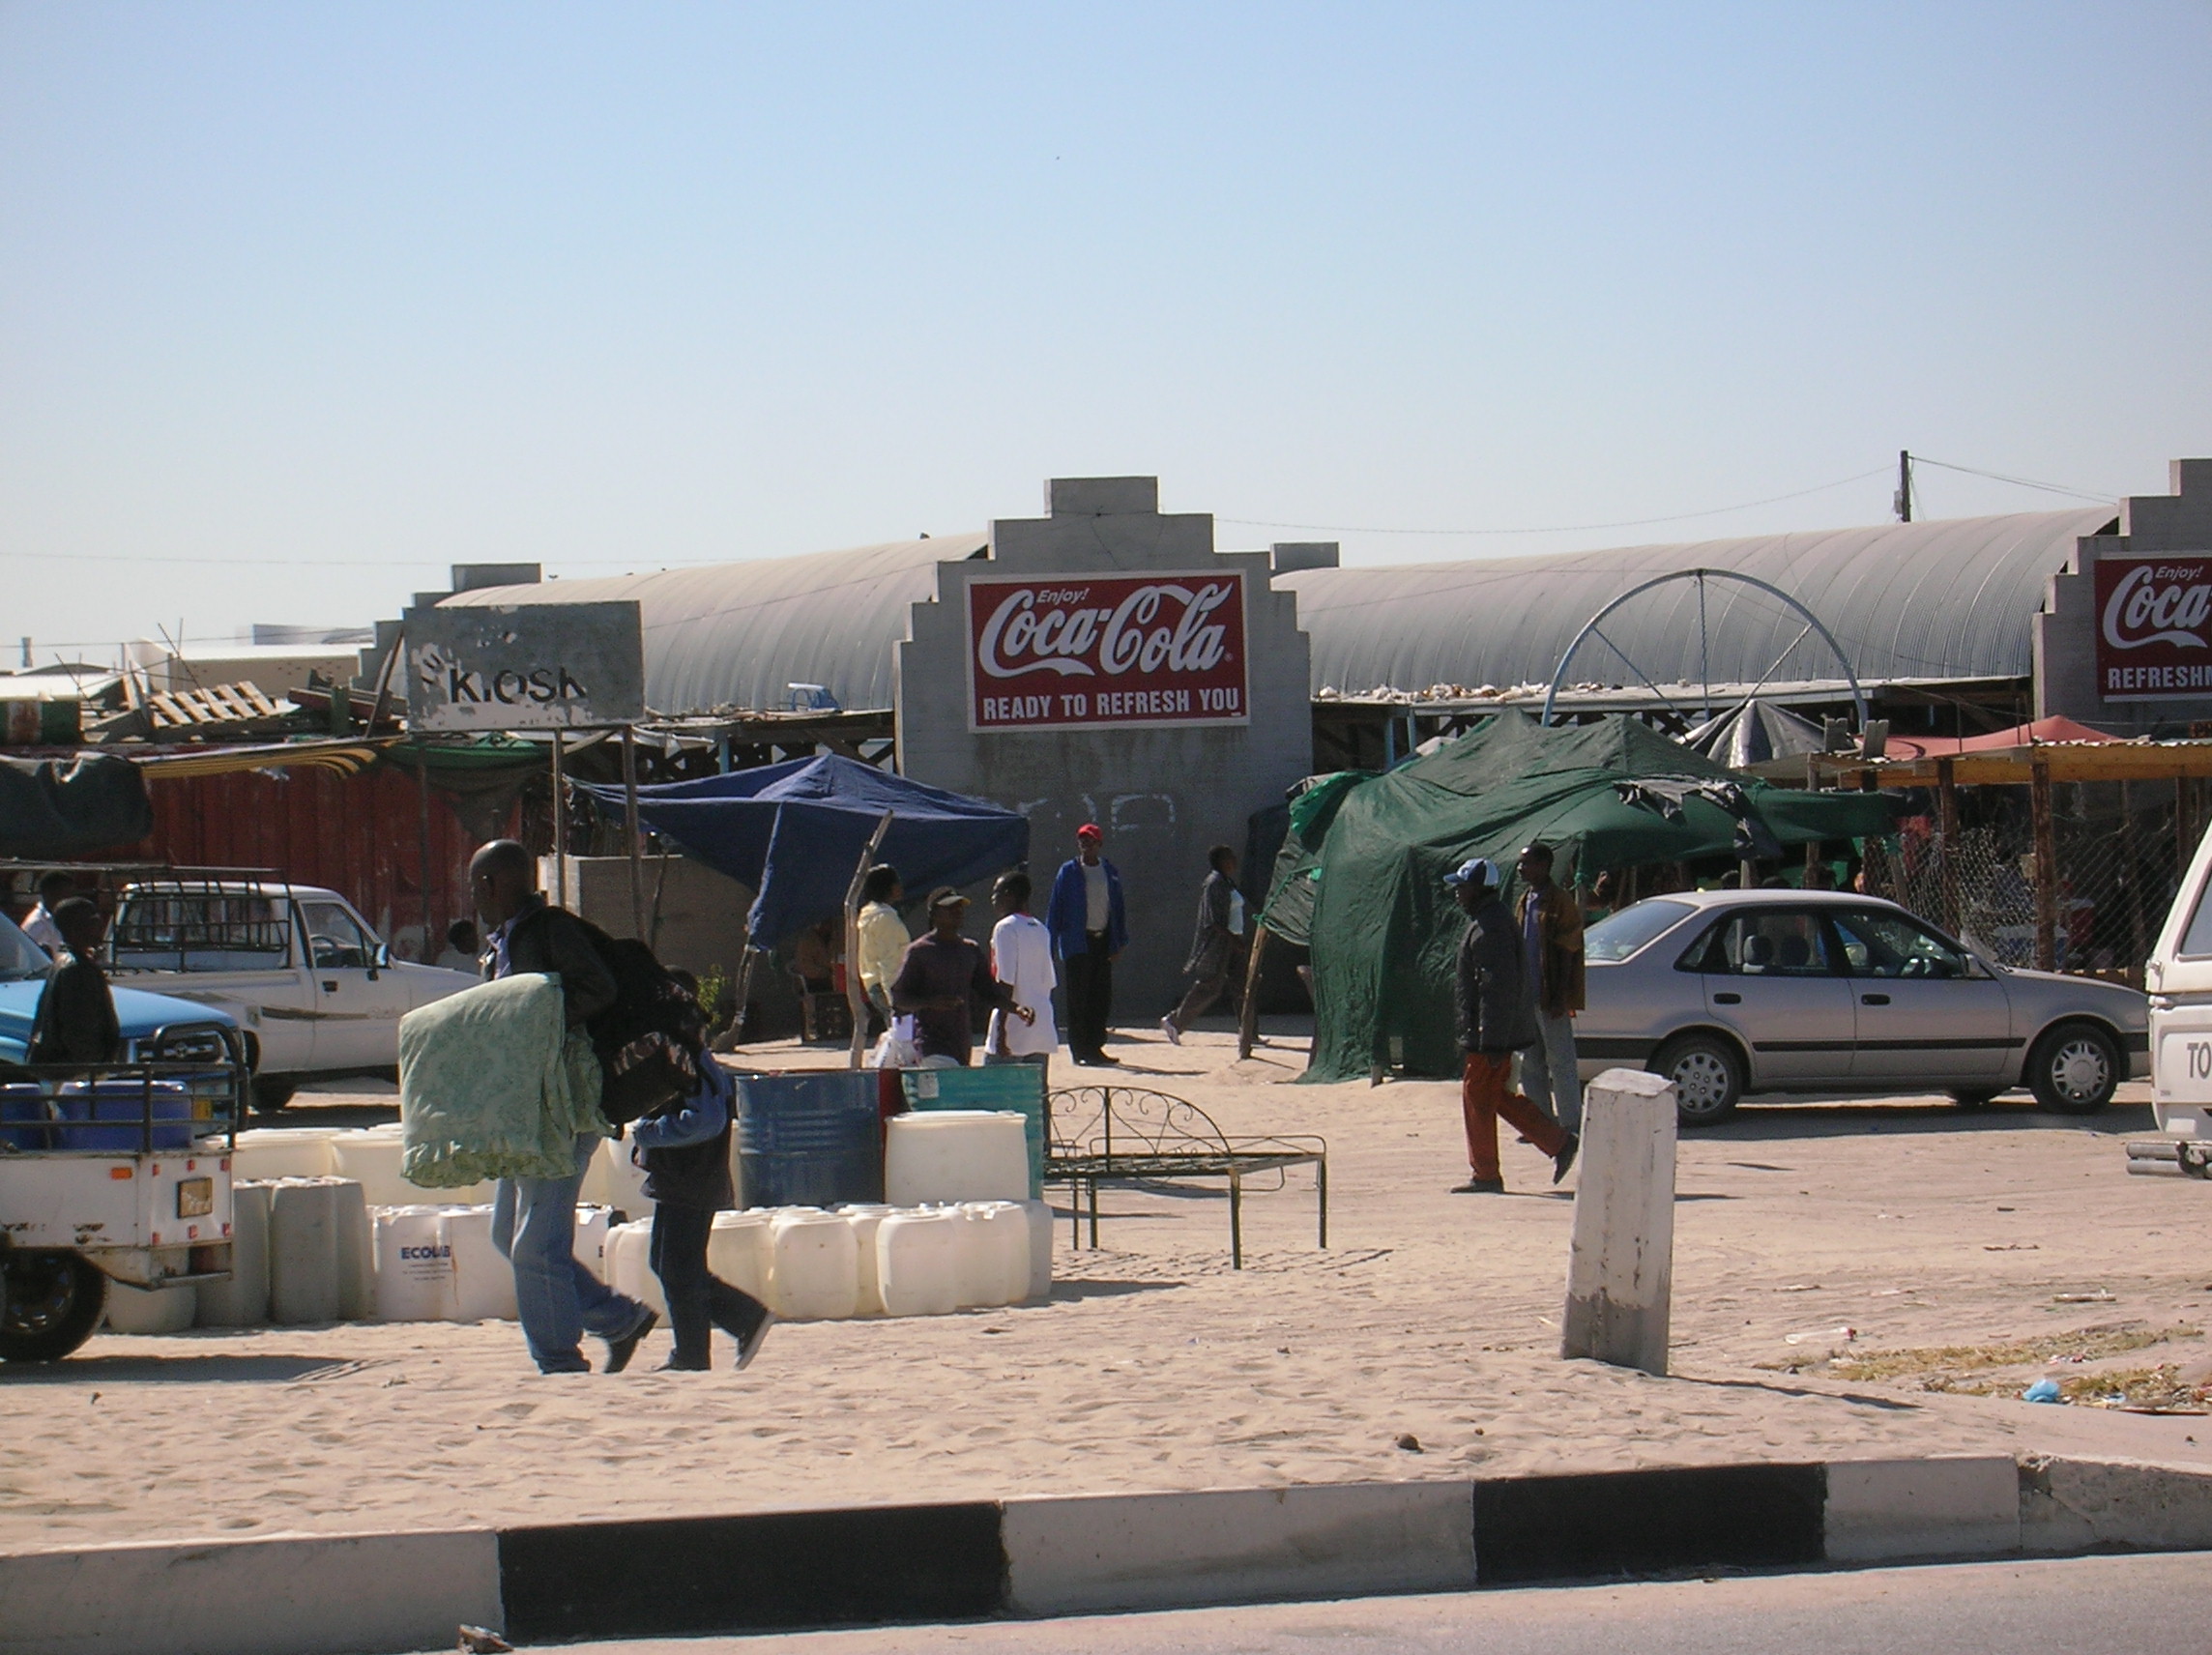
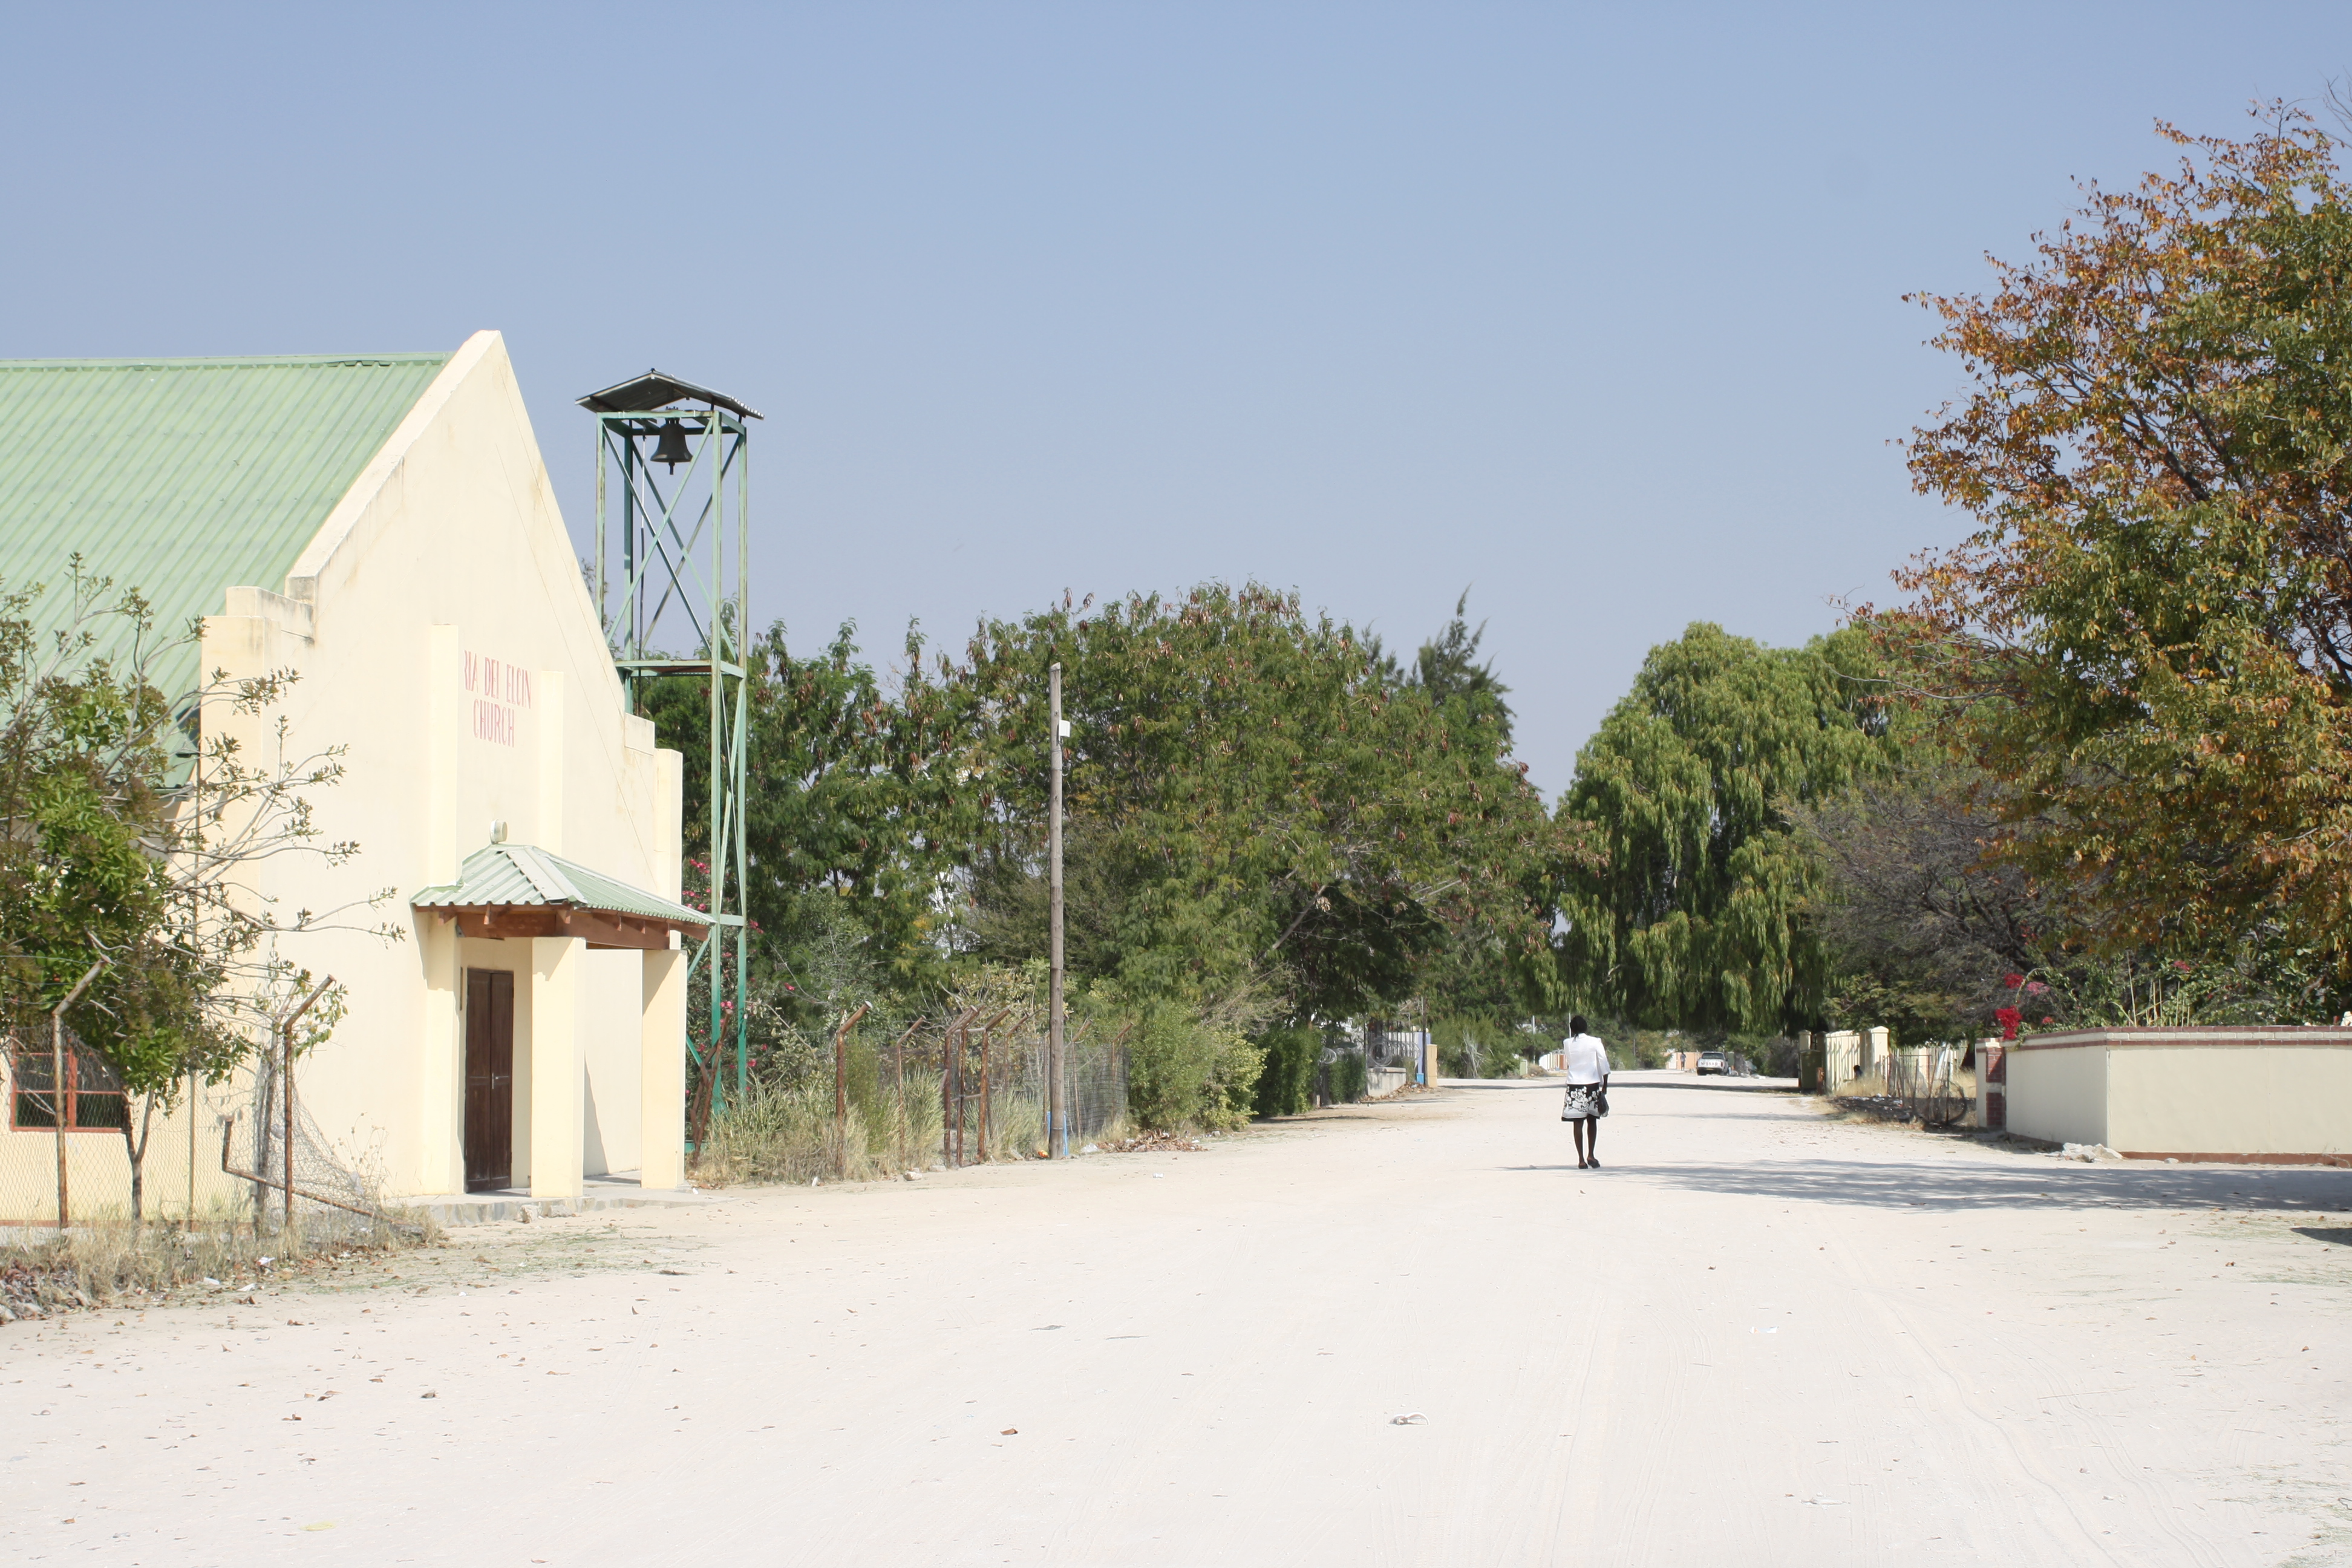
Outapi
Outapi, also known as Uutapi and Ombalantu, is a town in northern Namibia near the border with Angola situated 90 km (56 mi) northwest of Oshakati. It is the capital of Omusati region and the district capital of the Outapi electoral constituency. The..
Outapi Wikipedia Page

About Our Data
The data on this page is estimated using a number of publicly available tools and resources. It is provided without warranty, and could contain inaccuracies. Use at your own risk.