Categories in Tsandi
Industries
Business Distribution by Industry in Tsandi
| Industry Description | Number of Establishments |
|---|---|
| Bars, pubs and taverns | 7 |
Tsandi Facts
| Area | 0.8 km² |
| Population | 873 |
| Male Population | 390 (44.7%) |
| Female Population | 483 (55.3%) |
| Population change (1975 to 2020) | +114.0% |
| Population change (2000 to 2020) | +16.7% |
| Median Age | 19.1 years (Male: 17.4, Female: 21.4) |
| Area Codes | 65 |
| Local Time | |
| Timezone | Central Africa Time |
| Lat & Lng | -17.75000, 14.88333 |
Map of Tsandi
Interactive Map
Tsandi Population
Years 1975 to 2020
| Data | 1975 | 1990 | 2000 | 2015 | 2020 |
|---|---|---|---|---|---|
| Population | 408 | 600 | 748 | 810 | 873 |
| Population Density | 502.2 / km² | 738.5 / km² | 920.6 / km² | 996.9 / km² | 1,074.5 / km² |
Tsandi Population change from 2000 to 2015
Increase of 8.3% from year 2000 to 2015
| Location | Change since 1975 | Change since 1990 | Change since 2000 |
|---|---|---|---|
| Tsandi | +98.5% | +35% | +8.3% |
| Omusati Region | +125.3% | +48.4% | +16% |
| Namibia | +169.8% | +71.5% | +28.5% |
Tsandi Median Age
Median Age: 19.1 years
| Location | Median Age | Median Age (Female) | Median Age (Male) |
|---|---|---|---|
| Tsandi | 19.1 yrs | 21.4 yrs | 17.4 yrs |
| Omusati Region | 18.6 yrs | 20.6 yrs | 16.9 yrs |
| Namibia | 21.1 yrs | 21.7 yrs | 20.6 yrs |
Tsandi Population Density
Population Density: 1,075 / km²
| Location | Population | Area | Density |
|---|---|---|---|
| Tsandi | 873 | 0.813 km² | 1,075 / km² |
| Omusati Region | 272,543 | 26,599.3 km² | 10.2 / km² |
| Namibia | 2.5 million | 824,094.1 km² | 3 / km² |
Tsandi Historical and Projected Population
Estimated Population from 900 to 2100
- JRC (European Commission's Joint Research Centre) work on the GHS built-up grid
- CIESIN (Center for International Earth Science Information Network)
- [Link] Klein Goldewijk, K., Beusen, A., Doelman, J., and Stehfest, E.: Anthropogenic land use estimates for the Holocene – HYDE 3.2, Earth Syst. Sci. Data, 9, 927–953, https://doi.org/10.5194/essd-9-927-2017, 2017.
Human Development Index (HDI)
Statistic composite index of life expectancy, education, and per capita income.
Tsandi CO2 Emissions
Carbon Dioxide (CO2) Emissions Per Capita in Tonnes Per Year
| Location | CO2 Emissions | CO2 Emissions Per Capita | CO2 Emissions Intensity |
|---|---|---|---|
| Tsandi | 2,025 tn | 2.32 tn | 2,492.4 tons/km² |
| Omusati Region | 643,881 tn | 2.36 tn | 24.2 tons/km² |
| Namibia | 7,056,182 tn | 2.84 tn | 8.6 tons/km² |
| 2013 CO2 emissions (tonnes/year) | 2,025 tn |
| 2013 CO2 emissions (tonnes/year) per capita | 2.32 tn |
| 2013 CO2 emissions intensity (tonnes/km²/year) | 2,492.4 tons/km² |
Natural Hazards Risk
Relative risk out of 10
| Hazard | Risk Level |
|---|---|
| Drought | High (9) |
* Risk, particularly concerning flood or landslide, may not be for the entire area.
- Dilley, M., R.S. Chen, U. Deichmann, A.L. Lerner-Lam, M. Arnold, J. Agwe, P. Buys, O. Kjekstad, B. Lyon, and G. Yetman. 2005. Natural Disaster Hotspots: A Global Risk Analysis. Washington, D.C.: World Bank. https://doi.org/10.1596/0-8213-5930-4.
- Center for Hazards and Risk Research - CHRR - Columbia University, Center for International Earth Science Information Network - CIESIN - Columbia University, and International Research Institute for Climate and Society - IRI - Columbia University. 2005. Global Drought Hazard Frequency and Distribution. Palisades, NY: NASA Socioeconomic Data and Applications Center (SEDAC). https://doi.org/10.7927/H4VX0DFT.
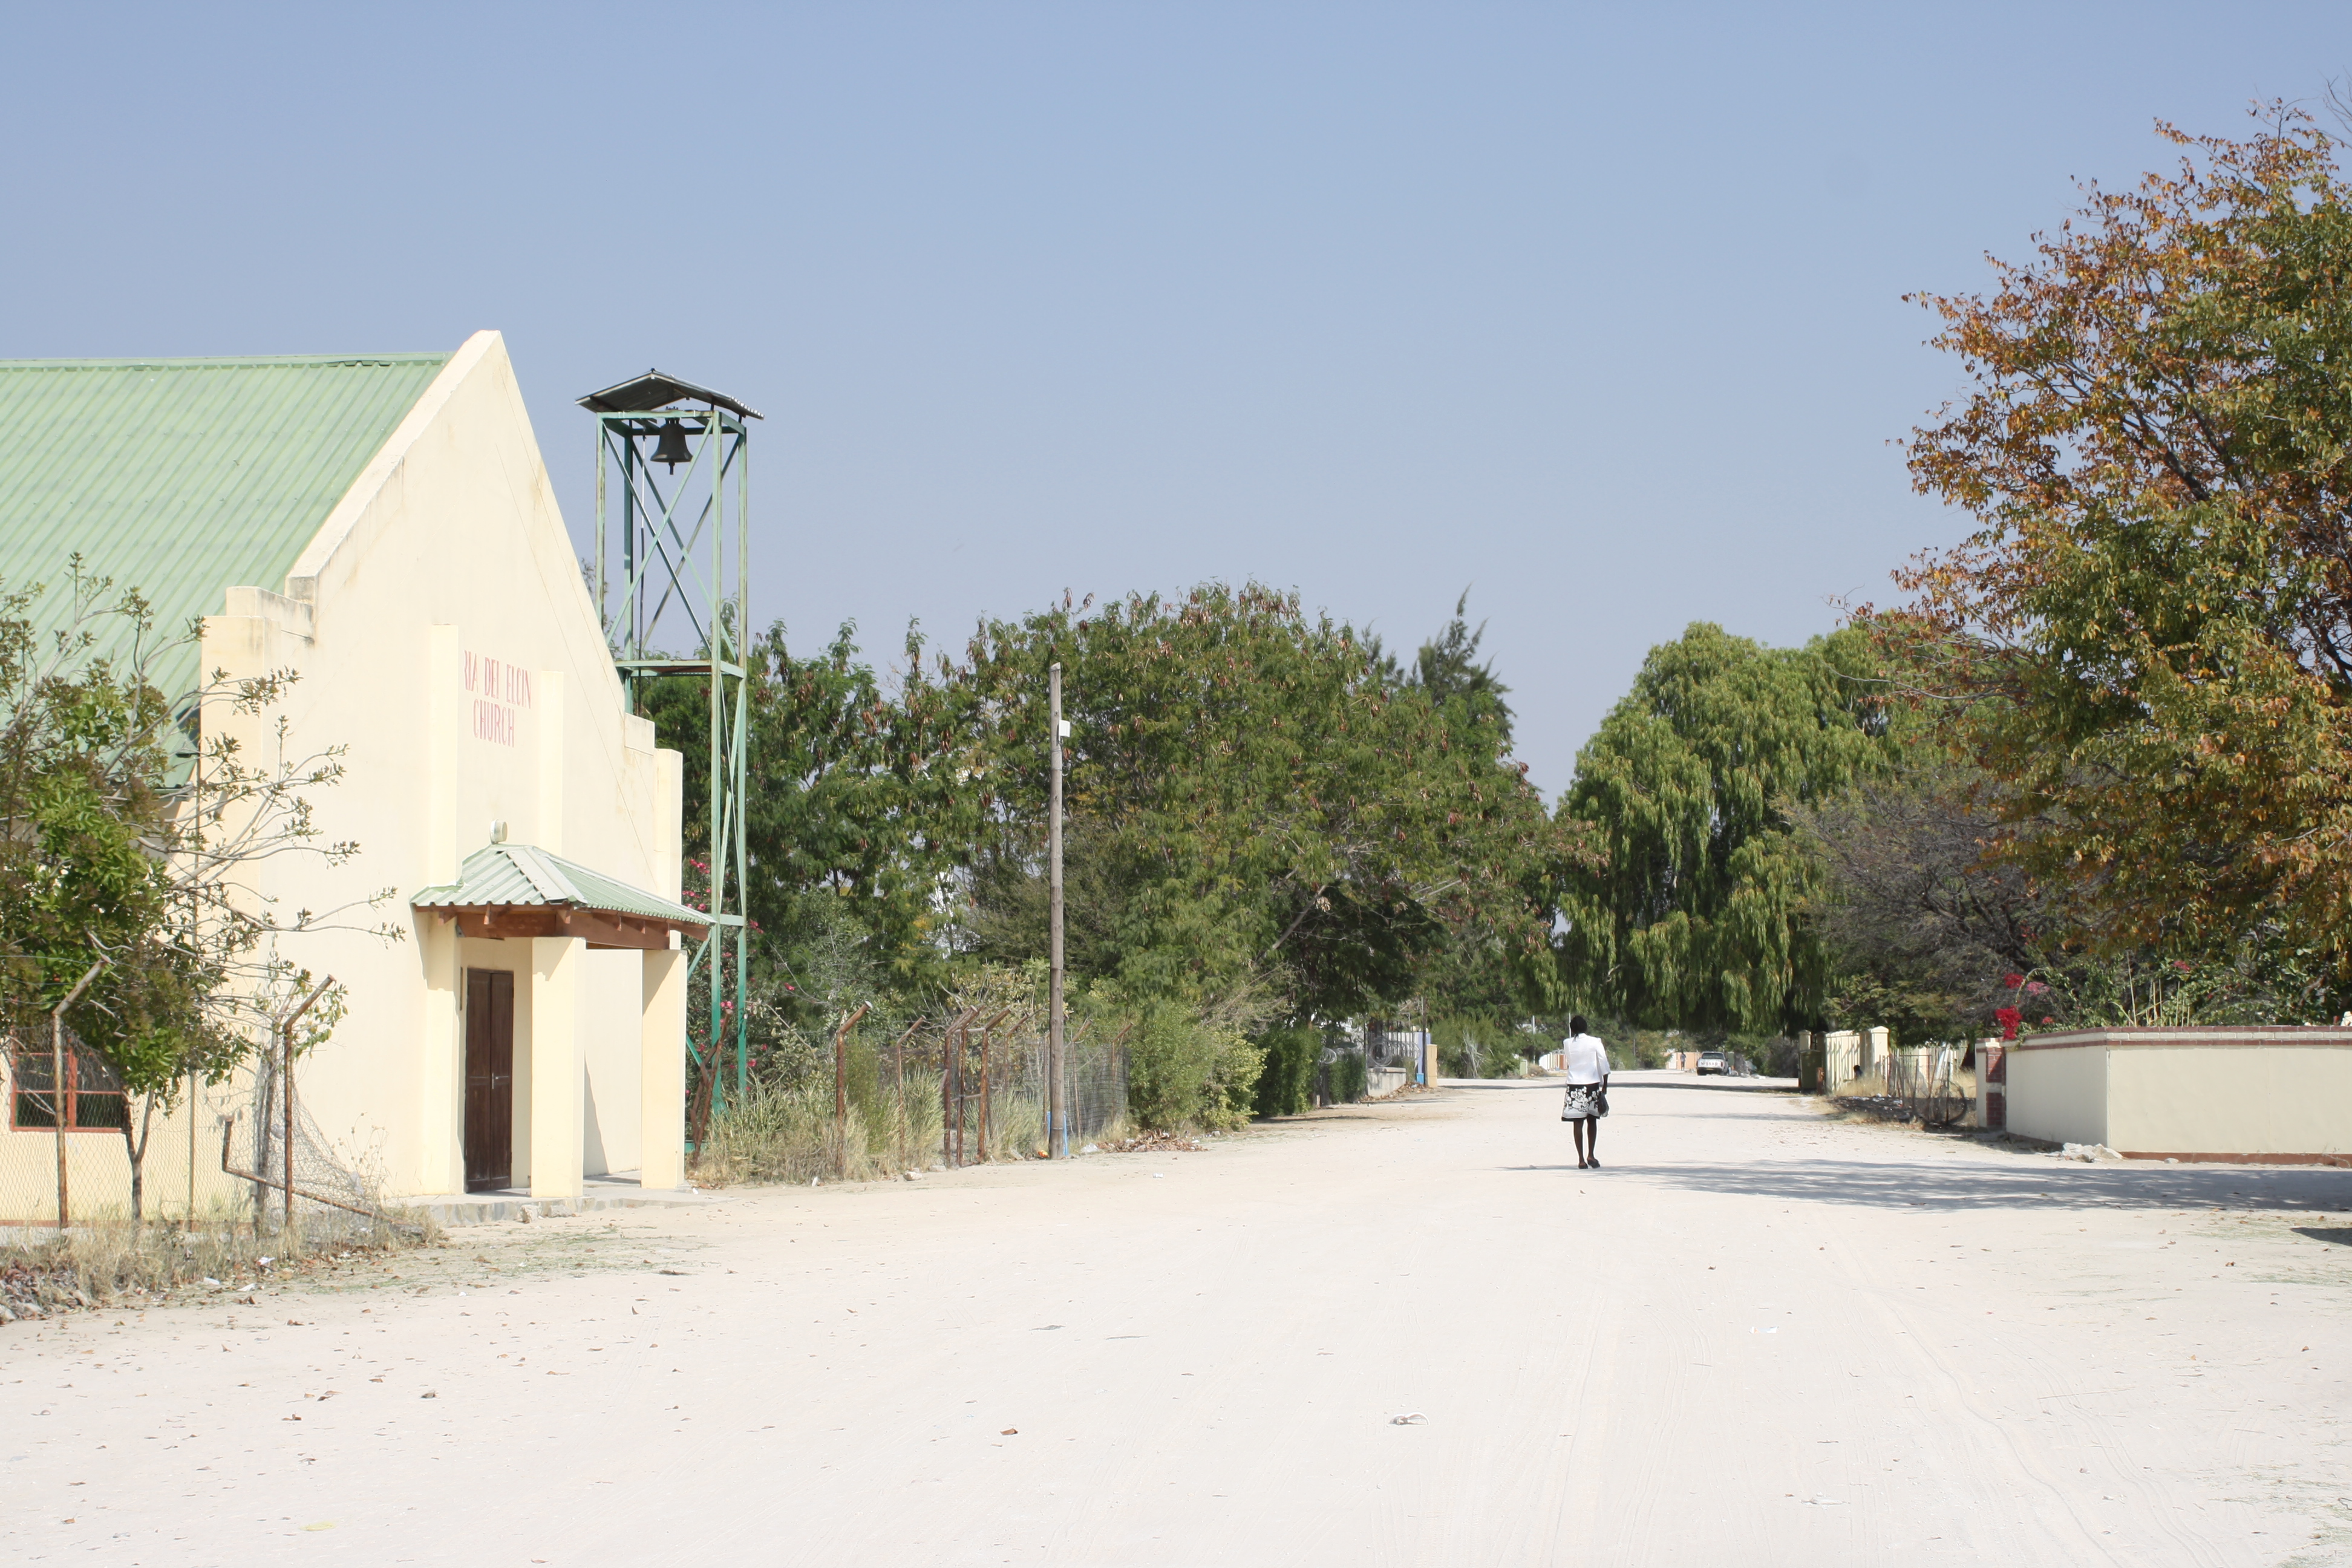
Tsandi
Tsandi (Oshiwambo: that which is at the center) is a village in the Omusati Region of northern Namibia and the district capital of the Tsandi electoral constituency. It is situated on the main road MR123 (Outapi - Tsandi - Okahao). is the residentia..
Tsandi Wikipedia Page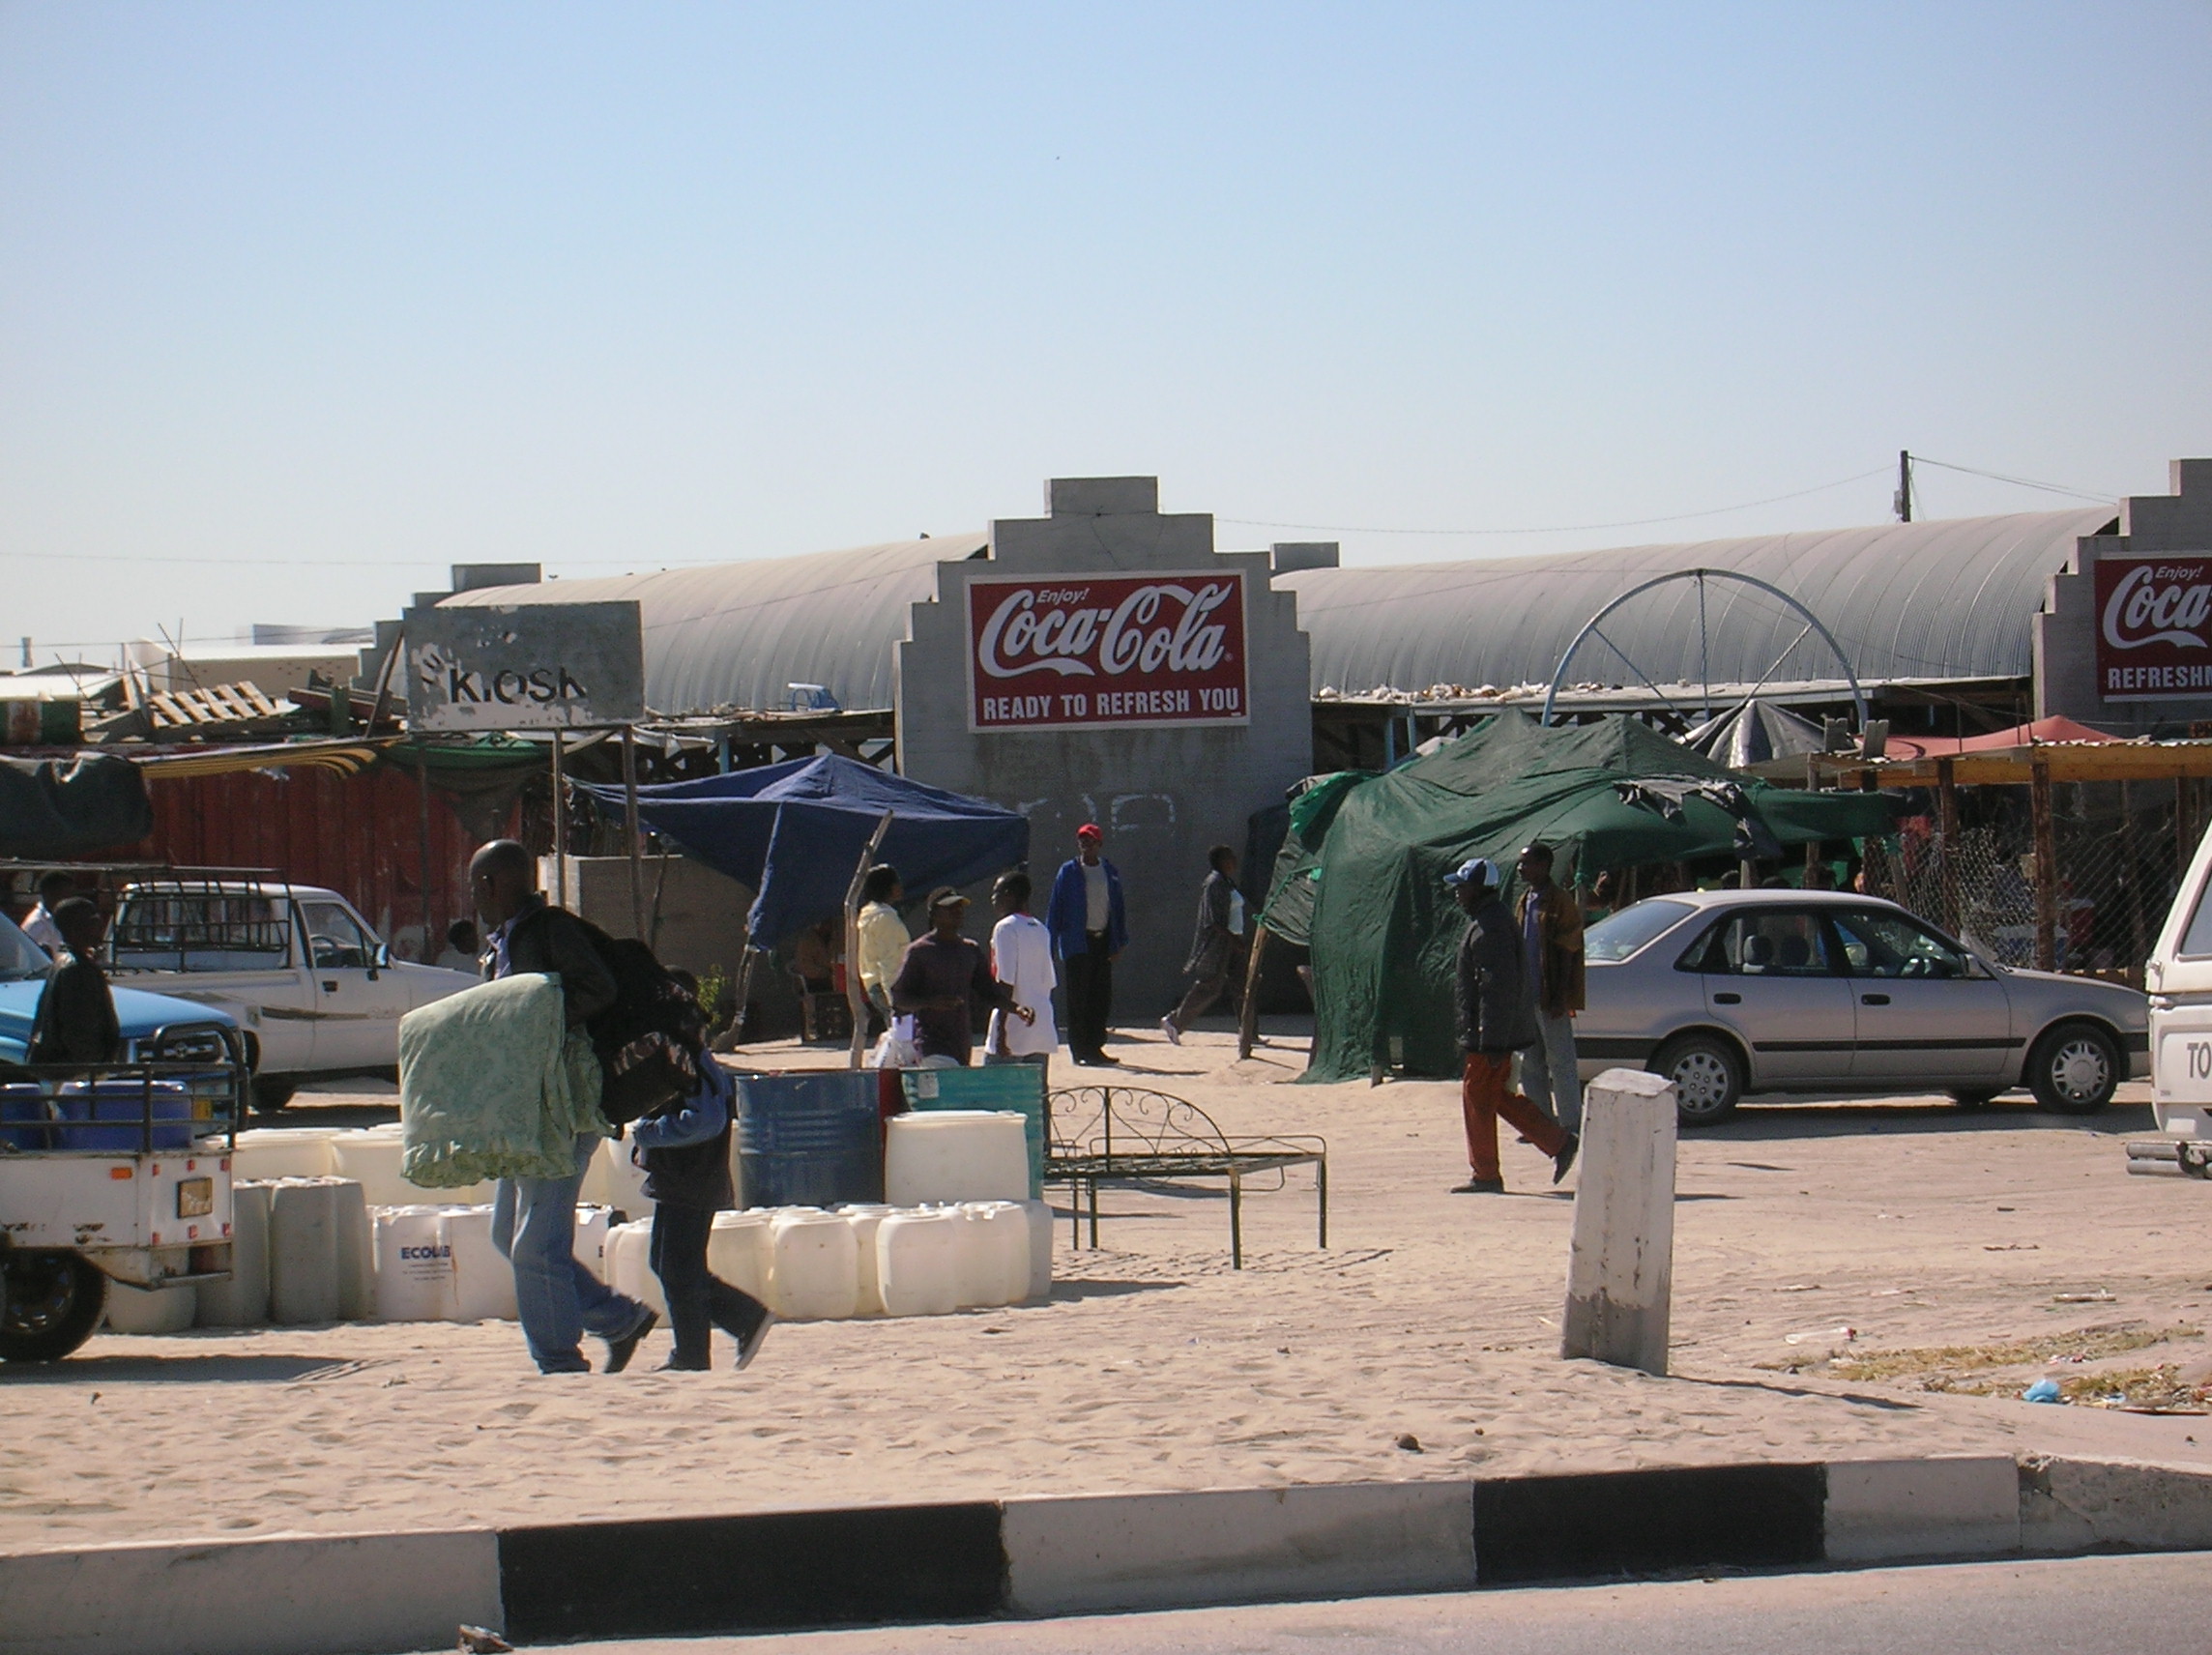

About Our Data
The data on this page is estimated using a number of publicly available tools and resources. It is provided without warranty, and could contain inaccuracies. Use at your own risk.