Industries
Business Distribution by Industry in Egbe
| Industry Description | Number of Establishments |
|---|---|
| Shopping other | 11 |
| Hotels and motels | 6 |
Egbe Facts
| Area | 1.4 km² |
| Population | 59,931 |
| Male Population | 30,440 (50.8%) |
| Female Population | 29,491 (49.2%) |
| Population change (1975 to 2020) | +147.2% |
| Population change (2000 to 2020) | +33.4% |
| Median Age | 17.6 years (Male: 16.9, Female: 18.3) |
| Neighborhoods | ile-iwe bus stop |
| Local Time | |
| Timezone | West Africa Time |
| Lat & Lng | 8.21667, 5.51667 |
Map of Egbe
Interactive Map
Egbe Population
Years 1975 to 2020
| Data | 1975 | 1990 | 2000 | 2015 | 2020 |
|---|---|---|---|---|---|
| Population | 24,243 | 36,523 | 44,929 | 53,549 | 59,931 |
| Population Density | 16,864.7 / km² | 25,407.3 / km² | 31,255 / km² | 37,251.5 / km² | 41,691.1 / km² |
Egbe Population change from 2000 to 2015
Increase of 19.2% from year 2000 to 2015
| Location | Change since 1975 | Change since 1990 | Change since 2000 |
|---|---|---|---|
| Egbe | +120.9% | +46.6% | +19.2% |
| Kogi | +171.5% | +83.7% | +45.1% |
| Nigeria | +186.7% | +90.6% | +48.3% |
Egbe Median Age
Median Age: 17.6 years
| Location | Median Age | Median Age (Female) | Median Age (Male) |
|---|---|---|---|
| Egbe | 17.6 yrs | 18.3 yrs | 16.9 yrs |
| Kogi | 17.3 yrs | 17.9 yrs | 16.7 yrs |
| Nigeria | 18.9 yrs | 19.3 yrs | 18.5 yrs |
Egbe Population Density
Population Density: 41,691 / km²
| Location | Population | Area | Density |
|---|---|---|---|
| Egbe | 59,931 | 1.438 km² | 41,691 / km² |
| Kogi | 4.1 million | 29,048.2 km² | 141 / km² |
| Nigeria | 182 million | 909,042.9 km² | 200 / km² |
Egbe Historical and Projected Population
Estimated Population from 1600 to 2100
- JRC (European Commission's Joint Research Centre) work on the GHS built-up grid
- CIESIN (Center for International Earth Science Information Network)
- [Link] Klein Goldewijk, K., Beusen, A., Doelman, J., and Stehfest, E.: Anthropogenic land use estimates for the Holocene – HYDE 3.2, Earth Syst. Sci. Data, 9, 927–953, https://doi.org/10.5194/essd-9-927-2017, 2017.
Area Codes
Percentage Area Codes used by businesses in Egbe
Price Distribution
Business distribution by price for Egbe
Human Development Index (HDI)
Statistic composite index of life expectancy, education, and per capita income.
Egbe CO2 Emissions
Carbon Dioxide (CO2) Emissions Per Capita in Tonnes Per Year
| Location | CO2 Emissions | CO2 Emissions Per Capita | CO2 Emissions Intensity |
|---|---|---|---|
| Egbe | 28,283 tn | 0.47 tn | 19,675.2 tons/km² |
| Kogi | 1,953,426 tn | 0.48 tn | 67.2 tons/km² |
| Nigeria | 86,705,254 tn | 0.48 tn | 95.4 tons/km² |
| 2013 CO2 emissions (tonnes/year) | 28,283 tn |
| 2013 CO2 emissions (tonnes/year) per capita | 0.47 tn |
| 2013 CO2 emissions intensity (tonnes/km²/year) | 19,675.2 tons/km² |
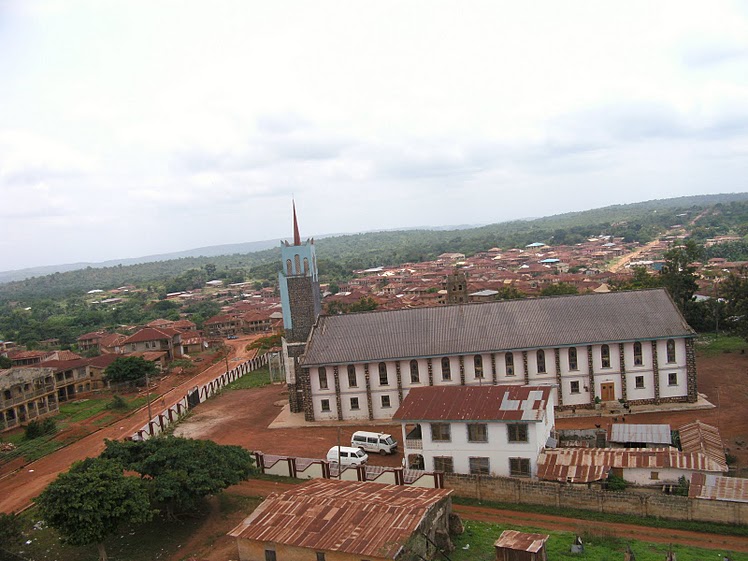
Egbe
Egbe Mekun, popularly called Egbe, is a historic town located in the Yagba West local government area of Kogi State, Nigeria, West Africa.
Egbe Wikipedia Page
About Our Data
The data on this page is estimated using a number of publicly available tools and resources. It is provided without warranty, and could contain inaccuracies. Use at your own risk.