Categories in Jaren
Car & Light Vehicle DealershipsCar repairCar Repair and MaintenanceNew car dealersUsed car dealersFarmingImport Export CompanyIndustrial & Construction ManufacturingAssociation or OrganizationConstruction of buildingsContractorGeneral contractorsHome Repair ContractorPainting and paint contractorsEducationMusic RelatedRestaurantsBeauty aidsHair SalonBack OfficeBusiness to Business ServiceConsulting & Advisory ServicesServices for IndustryReal Estate AgencyResidential Property RentalsBus StationElectric Vehicle Charging StationFreight/commercial transportTransportation Service
Industries
Business Distribution by Industry in Jaren
| Industry Description | Number of Establishments | Average Age of Business |
|---|---|---|
| Unreachable | 86 | — |
| Construction of buildings | 75 | 26 years |
| Buses and trains | 23 | — |
| Electronics stores | 21 | — |
| Car repair | 20 | 16 years |
| Transportation logistics | 18 | — |
| Wholesale of machinery | 17 | — |
| Other transport activities | 17 | — |
| Education | 16 | — |
| Other construction | 13 | — |
| Corporate management | 13 | — |
| Shopping | 12 | — |
| Beauty salons | 12 | — |
| Kitchen and bath cabinets and remodel | 11 | — |
Jaren Facts
| Area | 5.3 km² |
| Population | 3,754 |
| Male Population | 1,859 (49.5%) |
| Female Population | 1,895 (50.5%) |
| Population change (1975 to 2020) | -18.1% |
| Population change (2000 to 2020) | -11.4% |
| Median Age | 42.3 years (Male: 41.6, Female: 43.1) |
| Local Time | |
| Timezone | Central European Summer Time |
| Lat & Lng | 60.39273, 10.56155 |
| Postal Codes | 2711, 2712, 2714, 2718, 2770 |
Map of Jaren
Interactive Map
Jaren Population
Years 1975 to 2020
| Data | 1975 | 1990 | 2000 | 2015 | 2020 |
|---|---|---|---|---|---|
| Population | 4,581 | 4,560 | 4,239 | 3,590 | 3,754 |
| Population Density | 862.3 / km² | 858.4 / km² | 797.9 / km² | 675.8 / km² | 706.6 / km² |
Sources: JRC (European Commission's Joint Research Centre) work on the GHS built-up grid
Jaren Population change from 2000 to 2015
Decrease of 15.3% from year 2000 to 2015
| Location | Change since 1975 | Change since 1990 | Change since 2000 |
|---|---|---|---|
| Jaren | -21.6% | -21.3% | -15.3% |
| Oppland | -1.1% | +2.4% | +3.6% |
| Norway | +30.2% | +23.2% | +16.4% |
Sources: JRC (European Commission's Joint Research Centre) work on the GHS built-up grid
Jaren Median Age
Median Age: 42.3 years
| Location | Median Age | Median Age (Female) | Median Age (Male) |
|---|---|---|---|
| Jaren | 42.3 yrs | 43.1 yrs | 41.6 yrs |
| Oppland | 42.4 yrs | 43.4 yrs | 41.4 yrs |
| Norway | 38.8 yrs | 39.6 yrs | 38 yrs |
Sources: CIESIN (Center for International Earth Science Information Network)
Jaren Population Density
Population Density: 707 / km²
| Location | Population | Area | Density |
|---|---|---|---|
| Jaren | 3,754 | 5.3 km² | 707 / km² |
| Oppland | 190,710 | 25,191.6 km² | 7.6 / km² |
| Norway | 4.9 million | 322,754.2 km² | 15.2 / km² |
Sources: JRC (European Commission's Joint Research Centre) work on the GHS built-up grid
Jaren Historical and Projected Population
Estimated Population from 800 to 2100
Sources:
- JRC (European Commission's Joint Research Centre) work on the GHS built-up grid
- CIESIN (Center for International Earth Science Information Network)
- [Link] Klein Goldewijk, K., Beusen, A., Doelman, J., and Stehfest, E.: Anthropogenic land use estimates for the Holocene – HYDE 3.2, Earth Syst. Sci. Data, 9, 927–953, https://doi.org/10.5194/essd-9-927-2017, 2017.
Area Codes
Percentage Area Codes used by businesses in Jaren
Human Development Index (HDI)
Statistic composite index of life expectancy, education, and per capita income.
Source: [Link] Kummu, M., Taka, M. &Guillaume, J. Gridded global datasets for Gross Domestic Product and Human Development Index over 1990–2015. Sci Data 5, 180004 (2018) doi:10.1038/sdata.2018.4
Jaren CO2 Emissions
Carbon Dioxide (CO2) Emissions Per Capita in Tonnes Per Year
| Location | CO2 Emissions | CO2 Emissions Per Capita | CO2 Emissions Intensity |
|---|---|---|---|
| Jaren | 67,696 tn | 18.03 tn | 12,742.8 tons/km² |
| Oppland | 3,458,425 tn | 18.13 tn | 137.3 tons/km² |
| Norway | 86,855,170 tn | 17.74 tn | 269.1 tons/km² |
Sources: [Link] Moran, D., Kanemoto K; Jiborn, M., Wood, R., Többen, J., and Seto, K.C. (2018) Carbon footprints of 13,000 cities. Environmental Research Letters DOI: 10.1088/1748-9326/aac72a
Jaren CO2 Emissions
| 2013 CO2 emissions (tonnes/year) | 67,696 tn |
| 2013 CO2 emissions (tonnes/year) per capita | 18.03 tn |
| 2013 CO2 emissions intensity (tonnes/km²/year) | 12,742.8 tons/km² |
Recent Nearby Earthquakes
Magnitude 3.0 and greater
| Date▼ | Time↕ | Magnitude↕ | Distance↕ | Depth↕ | Location↕ | Link |
|---|---|---|---|---|---|---|
| 4/7/04 | 8:53 AM | 3.4 | 53.2 km | 22,900 m | southern Norway | usgs.gov |
| 11/19/94 | 9:07 AM | 3.5 | 43.6 km | 10,000 m | southern Norway | usgs.gov |
| 11/27/93 | 6:57 PM | 3.1 | 50.3 km | 10,000 m | southern Norway | usgs.gov |
Source: U.S. Geological Survey (USGS)
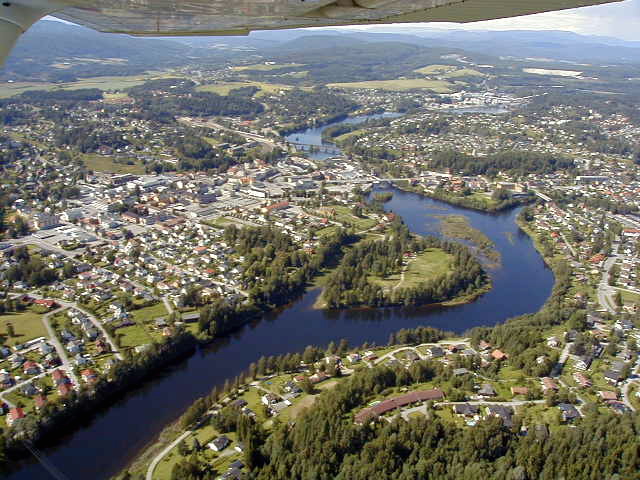
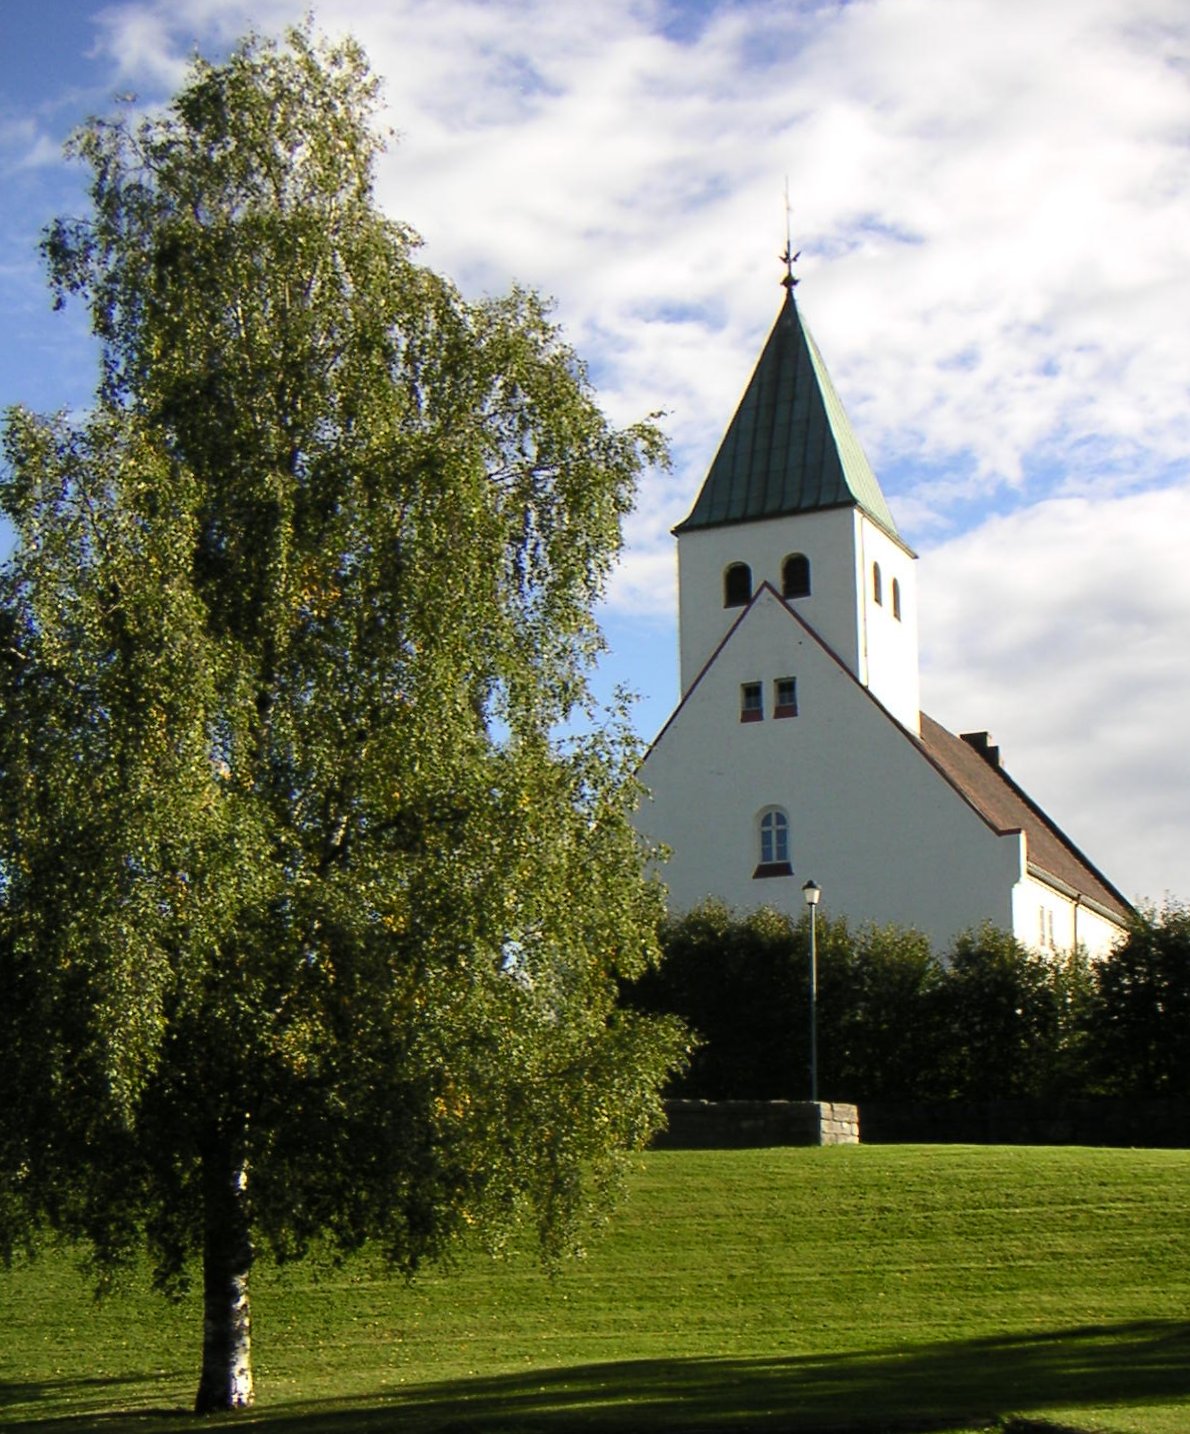
Jaren
Jaren is the administrative centre of Gran municipality, Norway. Together with Brandbu it forms an urban area with a population of 4,423.
Jaren Wikipedia Page

About Our Data
The data on this page is estimated using a number of publicly available tools and resources. It is provided without warranty, and could contain inaccuracies. Use at your own risk.