Industries
Business Distribution by Industry in Nydalen
| Industry Description | Number of Establishments |
|---|---|
| Corporate management | 16 |
| Education | 6 |
| Construction of buildings | 6 |
| Health and medical | 6 |
| Legal and financial | 5 |
| Creative arts | 5 |
| Advertising and marketing | 5 |
Nydalen Facts
| Area | 9.6 km² |
| Population | 18,250 |
| Male Population | 9,035 (49.5%) |
| Female Population | 9,215 (50.5%) |
| Population change (1975 to 2020) | +84.3% |
| Population change (2000 to 2020) | +35.4% |
| Median Age | 35.1 years (Male: 34.9, Female: 35.4) |
| Neighborhoods | Grefsen |
| Local Time | |
| Timezone | Central European Summer Time |
| Lat & Lng | 59.95000, 10.76667 |
| Postal Codes | 0484, 0485, 0486, 0489, 0492, More |
Map of Nydalen
Interactive Map
Nydalen Population
Years 1975 to 2020
| Data | 1975 | 1990 | 2000 | 2015 | 2020 |
|---|---|---|---|---|---|
| Population | 9,901 | 11,862 | 13,476 | 17,150 | 18,250 |
| Population Density | 1,035.4 / km² | 1,240.5 / km² | 1,409.3 / km² | 1,793.5 / km² | 1,908.5 / km² |
Sources: JRC (European Commission's Joint Research Centre) work on the GHS built-up grid
Nydalen Population change from 2000 to 2015
Increase of 27.3% from year 2000 to 2015
| Location | Change since 1975 | Change since 1990 | Change since 2000 |
|---|---|---|---|
| Nydalen | +73.2% | +44.6% | +27.3% |
| Oslo | +79.2% | +48.2% | +29.2% |
| Norway | +30.2% | +23.2% | +16.4% |
Sources: JRC (European Commission's Joint Research Centre) work on the GHS built-up grid
Nydalen Median Age
Median Age: 35.1 years
| Location | Median Age | Median Age (Female) | Median Age (Male) |
|---|---|---|---|
| Nydalen | 35.1 yrs | 35.4 yrs | 34.9 yrs |
| Oslo | 35.1 yrs | 35.4 yrs | 34.9 yrs |
| Norway | 38.8 yrs | 39.6 yrs | 38 yrs |
Sources: CIESIN (Center for International Earth Science Information Network)
Nydalen Population Density
Population Density: 1,909 / km²
| Location | Population | Area | Density |
|---|---|---|---|
| Nydalen | 18,250 | 9.6 km² | 1,909 / km² |
| Oslo | 652,447 | 480.7 km² | 1,357 / km² |
| Norway | 4.9 million | 322,754.2 km² | 15.2 / km² |
Sources: JRC (European Commission's Joint Research Centre) work on the GHS built-up grid
Nydalen Historical and Projected Population
Estimated Population from 1820 to 2100
Sources:
- JRC (European Commission's Joint Research Centre) work on the GHS built-up grid
- CIESIN (Center for International Earth Science Information Network)
- [Link] Klein Goldewijk, K., Beusen, A., Doelman, J., and Stehfest, E.: Anthropogenic land use estimates for the Holocene – HYDE 3.2, Earth Syst. Sci. Data, 9, 927–953, https://doi.org/10.5194/essd-9-927-2017, 2017.
Human Development Index (HDI)
Statistic composite index of life expectancy, education, and per capita income.
Source: [Link] Kummu, M., Taka, M. &Guillaume, J. Gridded global datasets for Gross Domestic Product and Human Development Index over 1990–2015. Sci Data 5, 180004 (2018) doi:10.1038/sdata.2018.4
Nydalen CO2 Emissions
Carbon Dioxide (CO2) Emissions Per Capita in Tonnes Per Year
| Location | CO2 Emissions | CO2 Emissions Per Capita | CO2 Emissions Intensity |
|---|---|---|---|
| Nydalen | 336,272 tn | 18.43 tn | 35,165.7 tons/km² |
| Oslo | 12,045,152 tn | 18.46 tn | 25,057.6 tons/km² |
| Norway | 86,855,170 tn | 17.74 tn | 269.1 tons/km² |
Sources: [Link] Moran, D., Kanemoto K; Jiborn, M., Wood, R., Többen, J., and Seto, K.C. (2018) Carbon footprints of 13,000 cities. Environmental Research Letters DOI: 10.1088/1748-9326/aac72a
Nydalen CO2 Emissions
| 2013 CO2 emissions (tonnes/year) | 336,272 tn |
| 2013 CO2 emissions (tonnes/year) per capita | 18.43 tn |
| 2013 CO2 emissions intensity (tonnes/km²/year) | 35,165.7 tons/km² |
Recent Nearby Earthquakes
Magnitude 3.0 and greater
| Date▼ | Time↕ | Magnitude↕ | Distance↕ | Depth↕ | Location↕ | Link |
|---|---|---|---|---|---|---|
| 4/7/04 | 8:53 AM | 3.4 | 73.5 km | 22,900 m | southern Norway | usgs.gov |
| 11/19/94 | 9:07 AM | 3.5 | 31.1 km | 10,000 m | southern Norway | usgs.gov |
| 11/27/93 | 6:57 PM | 3.1 | 60.9 km | 10,000 m | southern Norway | usgs.gov |
| 11/12/93 | 7:54 PM | 3.4 | 93.8 km | 10,000 m | Sweden | usgs.gov |
| 2/19/92 | 6:39 AM | 3.8 | 86.1 km | 10,000 m | southern Norway | usgs.gov |
Source: U.S. Geological Survey (USGS)
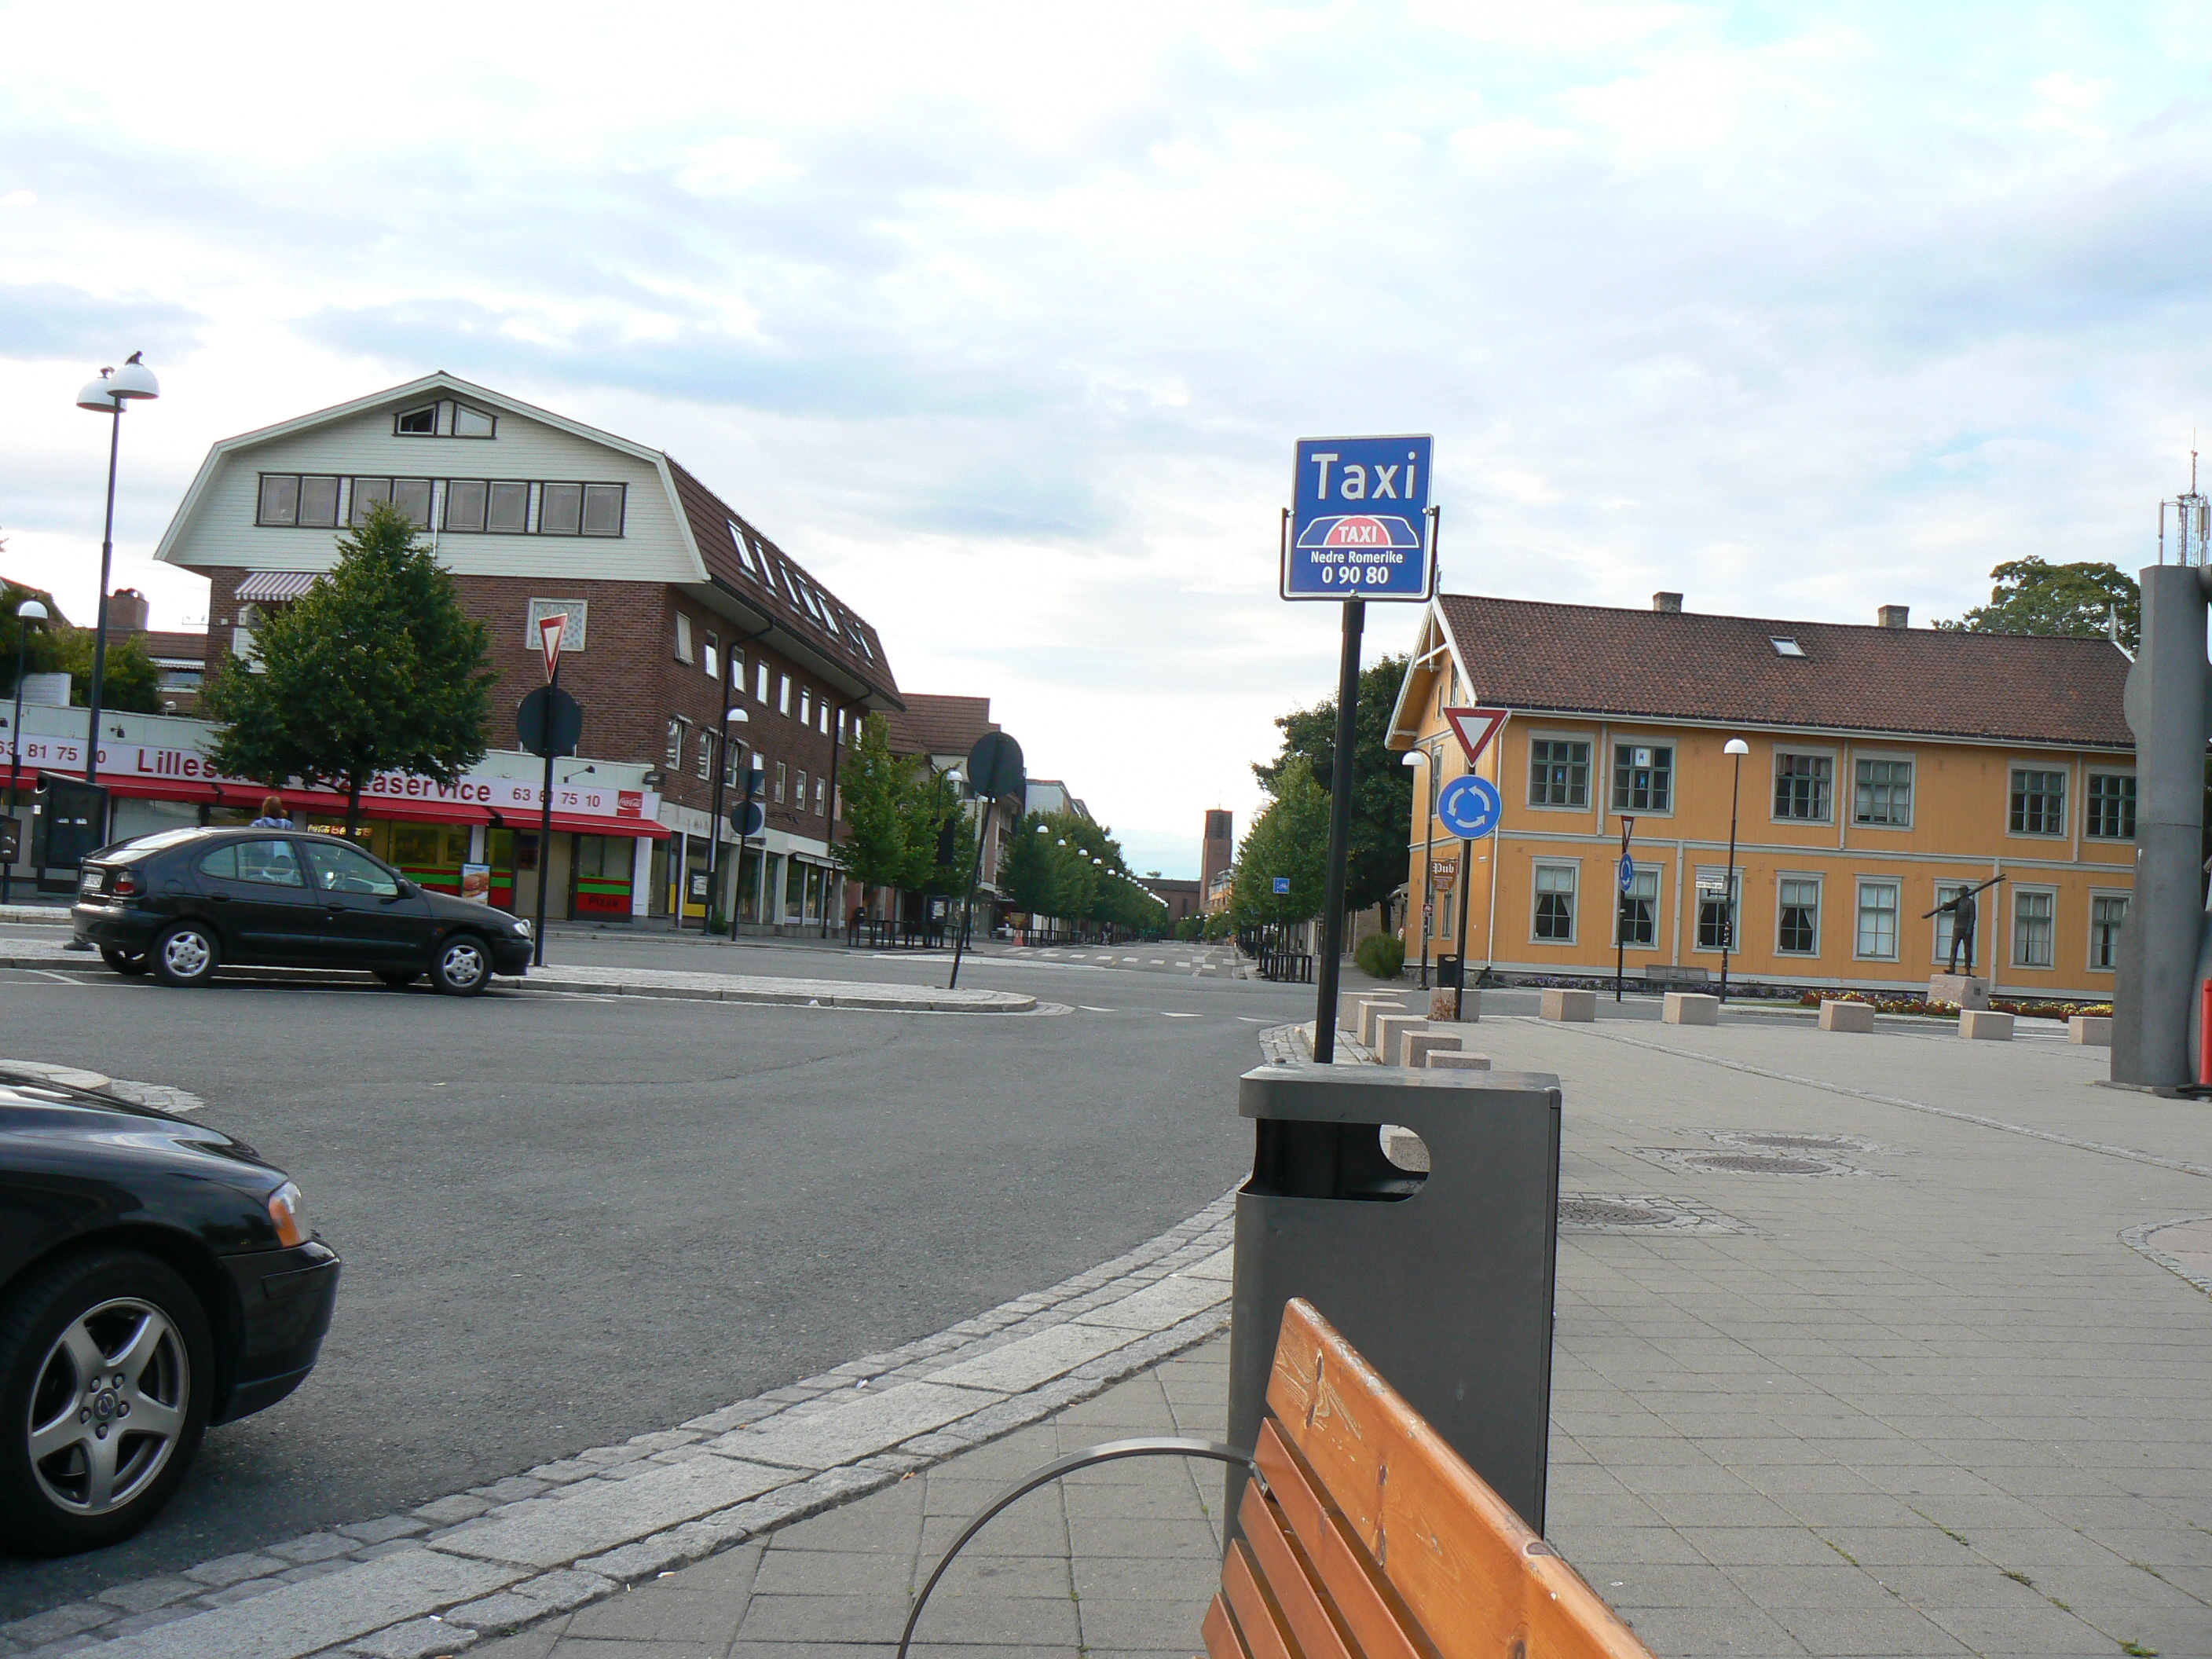
Nydalen
Nydalen is a neighbourhood in the Nordre Aker borough in northern Oslo, Norway.
Nydalen Wikipedia Page


About Our Data
The data on this page is estimated using a number of publicly available tools and resources. It is provided without warranty, and could contain inaccuracies. Use at your own risk.