Categories in Cusco
Industries
Business Distribution by Industry in Cusco
| Industry Description | Number of Establishments | Average Age of Business |
|---|---|---|
| Restaurants | 2,533 | 22 years |
| Travel agencies | 1,760 | 18 years |
| Other accommodation | 1,244 | 15 years |
| Hotels and motels | 1,144 | 15 years |
| Shopping | 871 | — |
| Education | 630 | 42 years |
| Tour operators | 573 | 15 years |
| Corporate management | 564 | 18 years |
| Travel and transportation | 520 | 21 years |
| Grocery stores and supermarkets | 431 | — |
| Clothing stores | 390 | — |
Cusco Facts
| Area | 85.2 km² |
| Population | 135,043 |
| Male Population | 65,033 (48.2%) |
| Female Population | 70,010 (51.8%) |
| Population change (1975 to 2020) | +89.8% |
| Population change (2000 to 2020) | +13.2% |
| Median Age | 26 years (Male: 25.3, Female: 26.7) |
| Area Codes | 84 |
| Neighborhoods | Centro Histórico, Wanchaq, Ttio, Periodista, Coripata |
| Local Time | |
| Timezone | Peru Standard Time |
| Lat & Lng | -13.52264, -71.96734 |
| Postal Codes | 08000, 08001, 08002, 08003, 08006, More |
Map of Cusco
Interactive Map
Cusco Population
Years 1975 to 2020
| Data | 1975 | 1990 | 2000 | 2015 | 2020 |
|---|---|---|---|---|---|
| Population | 71,164 | 103,406 | 119,332 | 129,717 | 135,043 |
| Population Density | 835.4 / km² | 1,213.9 / km² | 1,400.8 / km² | 1,522.7 / km² | 1,585.2 / km² |
Cusco Population change from 2000 to 2015
Increase of 8.7% from year 2000 to 2015
| Location | Change since 1975 | Change since 1990 | Change since 2000 |
|---|---|---|---|
| Cusco | +82.3% | +25.4% | +8.7% |
| Cusco Region | +63.1% | +21.9% | +9.7% |
| Peru | +104.4% | +42.6% | +20.2% |
Cusco Median Age
Median Age: 26 years
| Location | Median Age | Median Age (Female) | Median Age (Male) |
|---|---|---|---|
| Cusco | 26 yrs | 26.7 yrs | 25.3 yrs |
| Cusco Region | 23.3 yrs | 23.8 yrs | 22.7 yrs |
| Peru | 25.1 yrs | 25.6 yrs | 24.6 yrs |
Cusco Population Density
Population Density: 1,585 / km²
| Location | Population | Area | Density |
|---|---|---|---|
| Cusco | 135,043 | 85.2 km² | 1,585 / km² |
| Cusco Region | 1.3 million | 71,993.8 km² | 17.7 / km² |
| Peru | 31 million | 1,291,975 km² | 24 / km² |
Cusco Historical and Projected Population
Estimated Population from 0 to 2100
- JRC (European Commission's Joint Research Centre) work on the GHS built-up grid
- CIESIN (Center for International Earth Science Information Network)
- [Link] Klein Goldewijk, K., Beusen, A., Doelman, J., and Stehfest, E.: Anthropogenic land use estimates for the Holocene – HYDE 3.2, Earth Syst. Sci. Data, 9, 927–953, https://doi.org/10.5194/essd-9-927-2017, 2017.
Neighborhoods in Cusco
Percentage of businesses by neighborhood in Cusco
Area Codes
Percentage Area Codes used by businesses in Cusco
Price Distribution
Business distribution by price for Cusco
Human Development Index (HDI)
Statistic composite index of life expectancy, education, and per capita income.
Cusco CO2 Emissions
Carbon Dioxide (CO2) Emissions Per Capita in Tonnes Per Year
| Location | CO2 Emissions | CO2 Emissions Per Capita | CO2 Emissions Intensity |
|---|---|---|---|
| Cusco | 319,563 tn | 2.37 tn | 3,751.3 tons/km² |
| Cusco Region | 2,927,075 tn | 2.29 tn | 40.7 tons/km² |
| Peru | 71,626,946 tn | 2.31 tn | 55.4 tons/km² |
| 2013 CO2 emissions (tonnes/year) | 319,563 tn |
| 2013 CO2 emissions (tonnes/year) per capita | 2.37 tn |
| 2013 CO2 emissions intensity (tonnes/km²/year) | 3,751.3 tons/km² |
Natural Hazards Risk
Relative risk out of 10
| Hazard | Risk Level |
|---|---|
| Drought | Medium (4) |
| Flood | High (10) |
| Earthquake | Medium (6.8) |
| Landslide | Medium (6) |
* Risk, particularly concerning flood or landslide, may not be for the entire area.
- Dilley, M., R.S. Chen, U. Deichmann, A.L. Lerner-Lam, M. Arnold, J. Agwe, P. Buys, O. Kjekstad, B. Lyon, and G. Yetman. 2005. Natural Disaster Hotspots: A Global Risk Analysis. Washington, D.C.: World Bank. https://doi.org/10.1596/0-8213-5930-4.
- Center for Hazards and Risk Research - CHRR - Columbia University, Center for International Earth Science Information Network - CIESIN - Columbia University, and Norwegian Geotechnical Institute - NGI. 2005. Global Landslide Hazard Distribution. Palisades, NY: NASA Socioeconomic Data and Applications Center (SEDAC). https://doi.org/10.7927/H4P848VZ.
- Center for Hazards and Risk Research - CHRR - Columbia University, Center for International Earth Science Information Network - CIESIN - Columbia University, and International Research Institute for Climate and Society - IRI - Columbia University. 2005. Global Drought Hazard Frequency and Distribution. Palisades, NY: NASA Socioeconomic Data and Applications Center (SEDAC). https://doi.org/10.7927/H4VX0DFT.
- Center for Hazards and Risk Research - CHRR - Columbia University, Center for International Earth Science Information Network - CIESIN - Columbia University. 2005. Global Flood Hazard Frequency and Distribution. Palisades, NY: NASA Socioeconomic Data and Applications Center (SEDAC). https://doi.org/10.7927/H4668B3D.
- Center for Hazards and Risk Research - CHRR - Columbia University, Center for International Earth Science Information Network - CIESIN - Columbia University. 2005. Global Earthquake Hazard Distribution - Peak Ground Acceleration. Palisades, NY: NASA Socioeconomic Data and Applications Center (SEDAC). https://doi.org/10.7927/H4BZ63ZS.
Recent Nearby Earthquakes
Magnitude 3.0 and greater
| Date▼ | Time↕ | Magnitude↕ | Distance↕ | Depth↕ | Location↕ | Link |
|---|---|---|---|---|---|---|
| 11/11/18 | 11:11 AM | 4.2 | 20.1 km | 46,790 m | 3km NE of Pisac, Peru | usgs.gov |
| 10/25/18 | 6:03 AM | 4.3 | 47.3 km | 43,020 m | 37km SW of Urcos, Peru | usgs.gov |
| 6/16/18 | 2:51 AM | 4.6 | 64 km | 10,000 m | 38km ENE of Abancay, Peru | usgs.gov |
| 10/2/16 | 8:24 AM | 4.1 | 80.5 km | 71,230 m | 38km SE of Abancay, Peru | usgs.gov |
| 12/24/15 | 10:42 PM | 4.2 | 48.9 km | 47,430 m | 30km WSW of Anta, Peru | usgs.gov |
| 7/6/15 | 8:23 AM | 4.9 | 44.2 km | 36,660 m | 21km SSW of Urcos, Peru | usgs.gov |
| 9/28/14 | 2:35 AM | 4.9 | 46.1 km | 10,000 m | 19km SSW of Urcos, Peru | usgs.gov |
| 5/21/13 | 11:02 PM | 5.8 | 43.3 km | 92,000 m | 46km SW of Anta, Peru | usgs.gov |
| 1/18/13 | 7:51 PM | 4.5 | 99.4 km | 47,300 m | central Peru | usgs.gov |
| 9/20/12 | 6:08 AM | 4.9 | 79 km | 87,100 m | central Peru | usgs.gov |
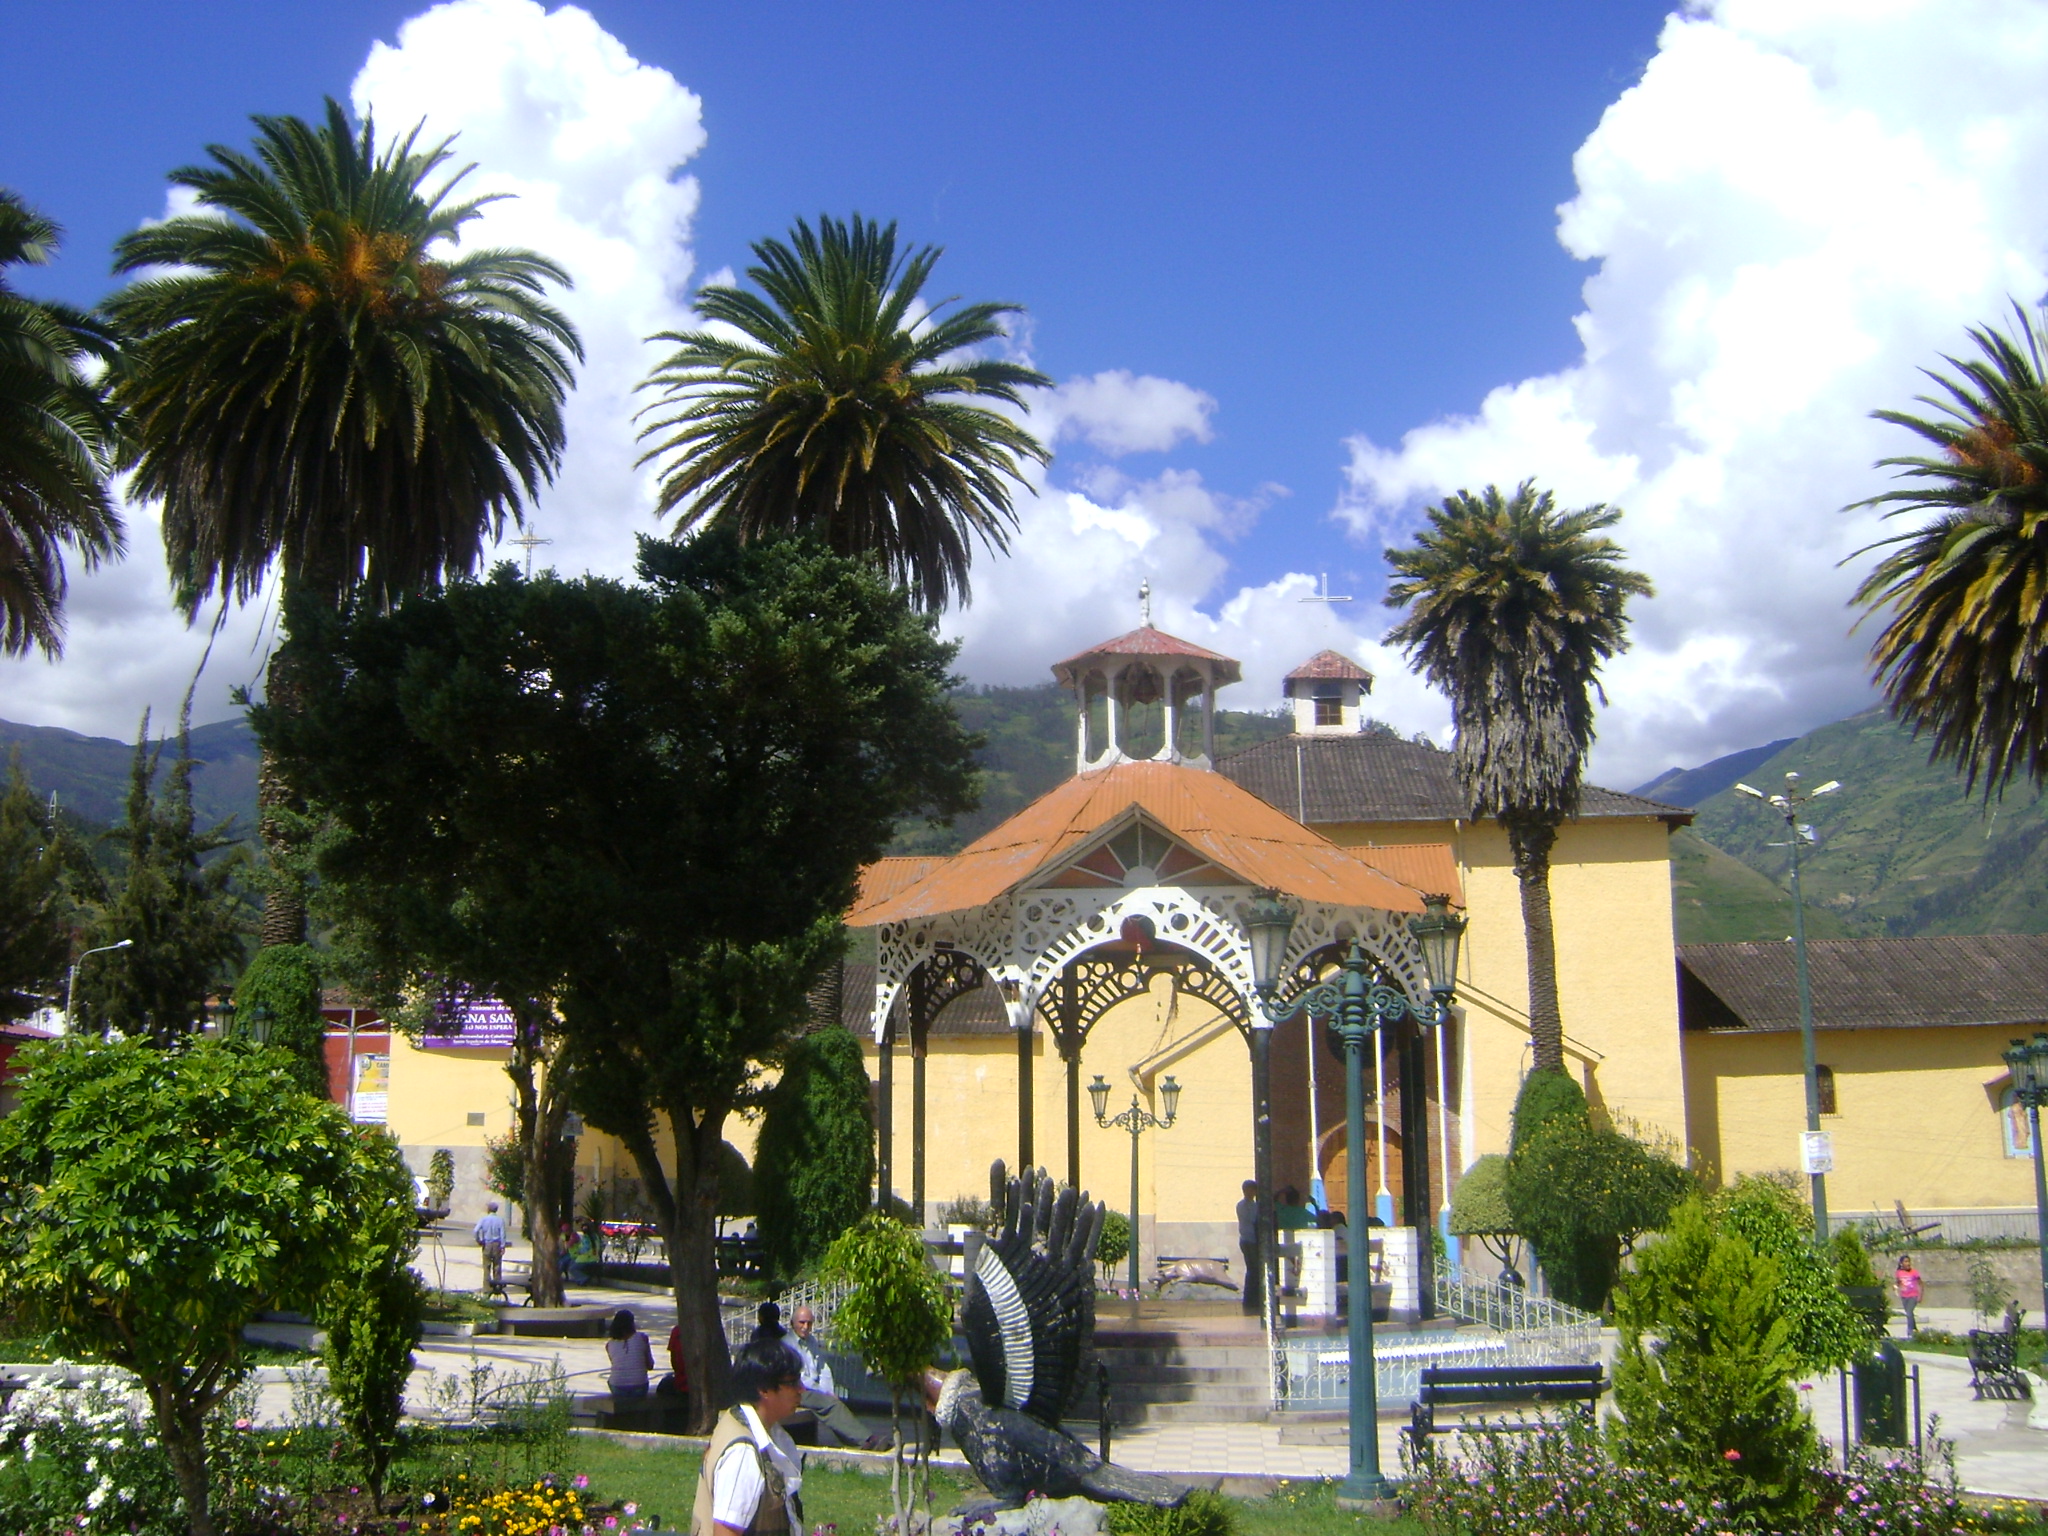
Cusco
Cusco (/ˈkuːzkoʊ/), often spelled Cuzco (Spanish: Cuzco, [ˈkusko] or [ˈkuθko]; Quechua: Qusqu or Qosqo, IPA: [ˈqɔsqɔ]), is a city in southeastern Peru, near the Urubamba Valley of the Andes mountain range. It is the capital of the Cusco Region as wel..
Cusco Wikipedia Page


About Our Data
The data on this page is estimated using a number of publicly available tools and resources. It is provided without warranty, and could contain inaccuracies. Use at your own risk.