Industries
Business Distribution by Industry in Urcos
| Industry Description | Number of Establishments |
|---|---|
| Restaurants | 22 |
| Hotels and motels | 13 |
| Shopping | 11 |
| Churches | 10 |
| Education | 7 |
| Gas station | 5 |
| Grocery stores and supermarkets | 5 |
| Secondary education | 5 |
Urcos Facts
| Area | 117.7 km² |
| Population | 9,151 |
| Male Population | 4,459 (48.7%) |
| Female Population | 4,692 (51.3%) |
| Population change (1975 to 2020) | -32.1% |
| Population change (2000 to 2020) | -24.3% |
| Median Age | 22.4 years (Male: 21.7, Female: 23.2) |
| Local Time | |
| Timezone | Peru Standard Time |
| Lat & Lng | -13.68611, -71.62278 |
| Postal Codes | 08219, 08220 |
Map of Urcos
Interactive Map
Urcos Population
Years 1975 to 2020
| Data | 1975 | 1990 | 2000 | 2015 | 2020 |
|---|---|---|---|---|---|
| Population | 13,486 | 13,419 | 12,085 | 8,991 | 9,151 |
| Population Density | 114.6 / km² | 114 / km² | 102.7 / km² | 76.4 / km² | 77.8 / km² |
Urcos Population change from 2000 to 2015
Decrease of 25.6% from year 2000 to 2015
| Location | Change since 1975 | Change since 1990 | Change since 2000 |
|---|---|---|---|
| Urcos | -33.3% | -33% | -25.6% |
| Cusco Region | +63.1% | +21.9% | +9.7% |
| Peru | +104.4% | +42.6% | +20.2% |
Urcos Median Age
Median Age: 22.4 years
| Location | Median Age | Median Age (Female) | Median Age (Male) |
|---|---|---|---|
| Urcos | 22.4 yrs | 23.2 yrs | 21.7 yrs |
| Cusco Region | 23.3 yrs | 23.8 yrs | 22.7 yrs |
| Peru | 25.1 yrs | 25.6 yrs | 24.6 yrs |
Urcos Population Density
Population Density: 77.8 / km²
| Location | Population | Area | Density |
|---|---|---|---|
| Urcos | 9,151 | 117.7 km² | 77.8 / km² |
| Cusco Region | 1.3 million | 71,993.8 km² | 17.7 / km² |
| Peru | 31 million | 1,291,975 km² | 24 / km² |
Urcos Historical and Projected Population
Estimated Population from 0 to 2100
- JRC (European Commission's Joint Research Centre) work on the GHS built-up grid
- CIESIN (Center for International Earth Science Information Network)
- [Link] Klein Goldewijk, K., Beusen, A., Doelman, J., and Stehfest, E.: Anthropogenic land use estimates for the Holocene – HYDE 3.2, Earth Syst. Sci. Data, 9, 927–953, https://doi.org/10.5194/essd-9-927-2017, 2017.
Human Development Index (HDI)
Statistic composite index of life expectancy, education, and per capita income.
Urcos CO2 Emissions
Carbon Dioxide (CO2) Emissions Per Capita in Tonnes Per Year
| Location | CO2 Emissions | CO2 Emissions Per Capita | CO2 Emissions Intensity |
|---|---|---|---|
| Urcos | 21,024 tn | 2.3 tn | 178.6 tons/km² |
| Cusco Region | 2,927,075 tn | 2.29 tn | 40.7 tons/km² |
| Peru | 71,626,946 tn | 2.31 tn | 55.4 tons/km² |
| 2013 CO2 emissions (tonnes/year) | 21,024 tn |
| 2013 CO2 emissions (tonnes/year) per capita | 2.3 tn |
| 2013 CO2 emissions intensity (tonnes/km²/year) | 178.6 tons/km² |
Natural Hazards Risk
Relative risk out of 10
| Hazard | Risk Level |
|---|---|
| Drought | Medium (4) |
| Flood | High (10) |
| Earthquake | Medium (6) |
| Landslide | Medium (6) |
* Risk, particularly concerning flood or landslide, may not be for the entire area.
- Dilley, M., R.S. Chen, U. Deichmann, A.L. Lerner-Lam, M. Arnold, J. Agwe, P. Buys, O. Kjekstad, B. Lyon, and G. Yetman. 2005. Natural Disaster Hotspots: A Global Risk Analysis. Washington, D.C.: World Bank. https://doi.org/10.1596/0-8213-5930-4.
- Center for Hazards and Risk Research - CHRR - Columbia University, Center for International Earth Science Information Network - CIESIN - Columbia University, and Norwegian Geotechnical Institute - NGI. 2005. Global Landslide Hazard Distribution. Palisades, NY: NASA Socioeconomic Data and Applications Center (SEDAC). https://doi.org/10.7927/H4P848VZ.
- Center for Hazards and Risk Research - CHRR - Columbia University, Center for International Earth Science Information Network - CIESIN - Columbia University, and International Research Institute for Climate and Society - IRI - Columbia University. 2005. Global Drought Hazard Frequency and Distribution. Palisades, NY: NASA Socioeconomic Data and Applications Center (SEDAC). https://doi.org/10.7927/H4VX0DFT.
- Center for Hazards and Risk Research - CHRR - Columbia University, Center for International Earth Science Information Network - CIESIN - Columbia University. 2005. Global Flood Hazard Frequency and Distribution. Palisades, NY: NASA Socioeconomic Data and Applications Center (SEDAC). https://doi.org/10.7927/H4668B3D.
- Center for Hazards and Risk Research - CHRR - Columbia University, Center for International Earth Science Information Network - CIESIN - Columbia University. 2005. Global Earthquake Hazard Distribution - Peak Ground Acceleration. Palisades, NY: NASA Socioeconomic Data and Applications Center (SEDAC). https://doi.org/10.7927/H4BZ63ZS.
Recent Nearby Earthquakes
Magnitude 3.0 and greater
| Date▼ | Time↕ | Magnitude↕ | Distance↕ | Depth↕ | Location↕ | Link |
|---|---|---|---|---|---|---|
| 6/1/19 | 5:55 PM | 4.6 | 91.1 km | 26,210 m | 3km SSW of Marangani, Peru | usgs.gov |
| 11/11/18 | 11:11 AM | 4.2 | 38.8 km | 46,790 m | 3km NE of Pisac, Peru | usgs.gov |
| 10/25/18 | 6:03 AM | 4.3 | 37.5 km | 43,020 m | 37km SW of Urcos, Peru | usgs.gov |
| 10/5/18 | 1:46 AM | 5.2 | 95.5 km | 10,000 m | 18km WSW of Checca, Peru | usgs.gov |
| 12/24/15 | 10:42 PM | 4.2 | 87.8 km | 47,430 m | 30km WSW of Anta, Peru | usgs.gov |
| 7/6/15 | 8:23 AM | 4.9 | 21.3 km | 36,660 m | 21km SSW of Urcos, Peru | usgs.gov |
| 9/28/14 | 2:35 AM | 4.9 | 19 km | 10,000 m | 19km SSW of Urcos, Peru | usgs.gov |
| 5/21/13 | 11:02 PM | 5.8 | 70.1 km | 92,000 m | 46km SW of Anta, Peru | usgs.gov |
| 1/18/13 | 7:51 PM | 4.5 | 89.9 km | 47,300 m | central Peru | usgs.gov |
| 5/14/11 | 5:22 PM | 4.2 | 41.8 km | 35,000 m | central Peru | usgs.gov |
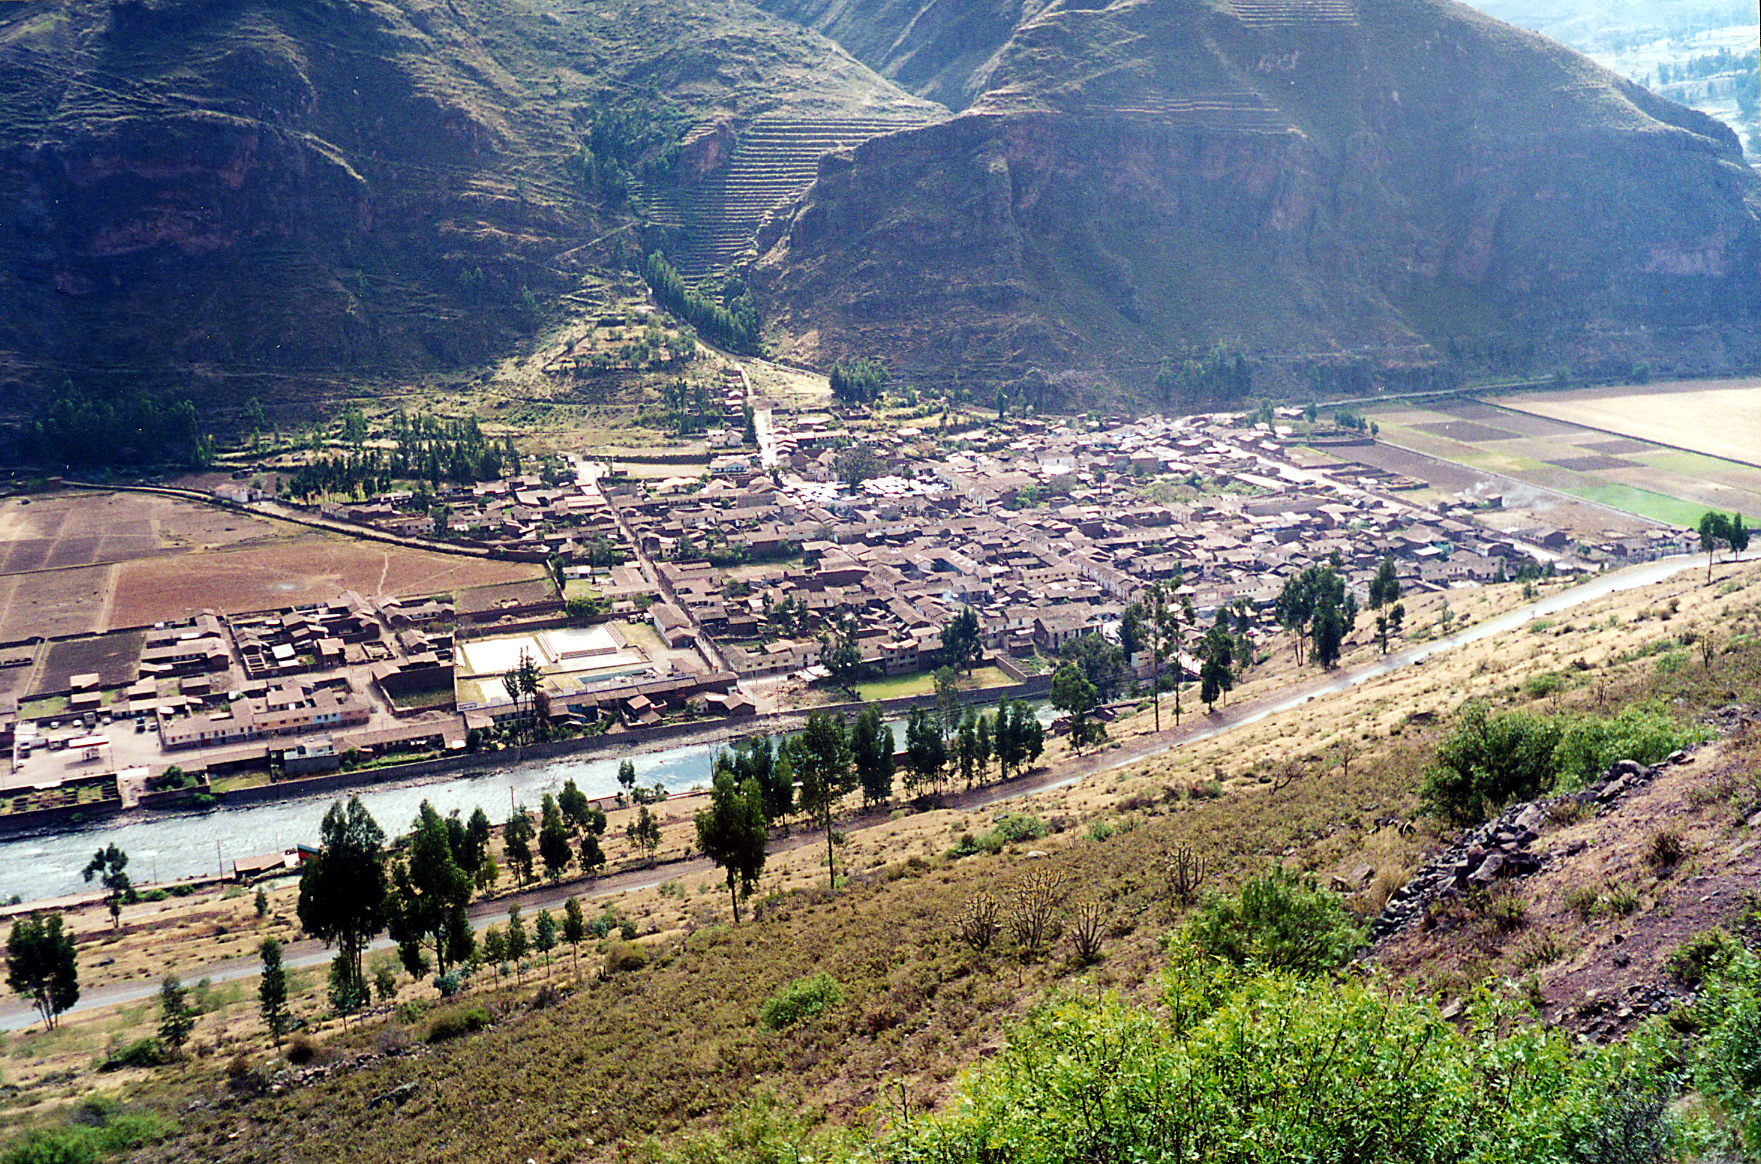
Urcos
Urcos is a small town in eastern Peru, capital of the province Quispicanchi in the region Cusco. It is home to a small lake and ruins.
Urcos Wikipedia Page


About Our Data
The data on this page is estimated using a number of publicly available tools and resources. It is provided without warranty, and could contain inaccuracies. Use at your own risk.