Categories in Kibaha
Industries
Business Distribution by Industry in Kibaha
| Industry Description | Number of Establishments |
|---|---|
| Education | 51 |
| Hospitals | 32 |
| Primary and elementary schools | 31 |
| Shopping | 27 |
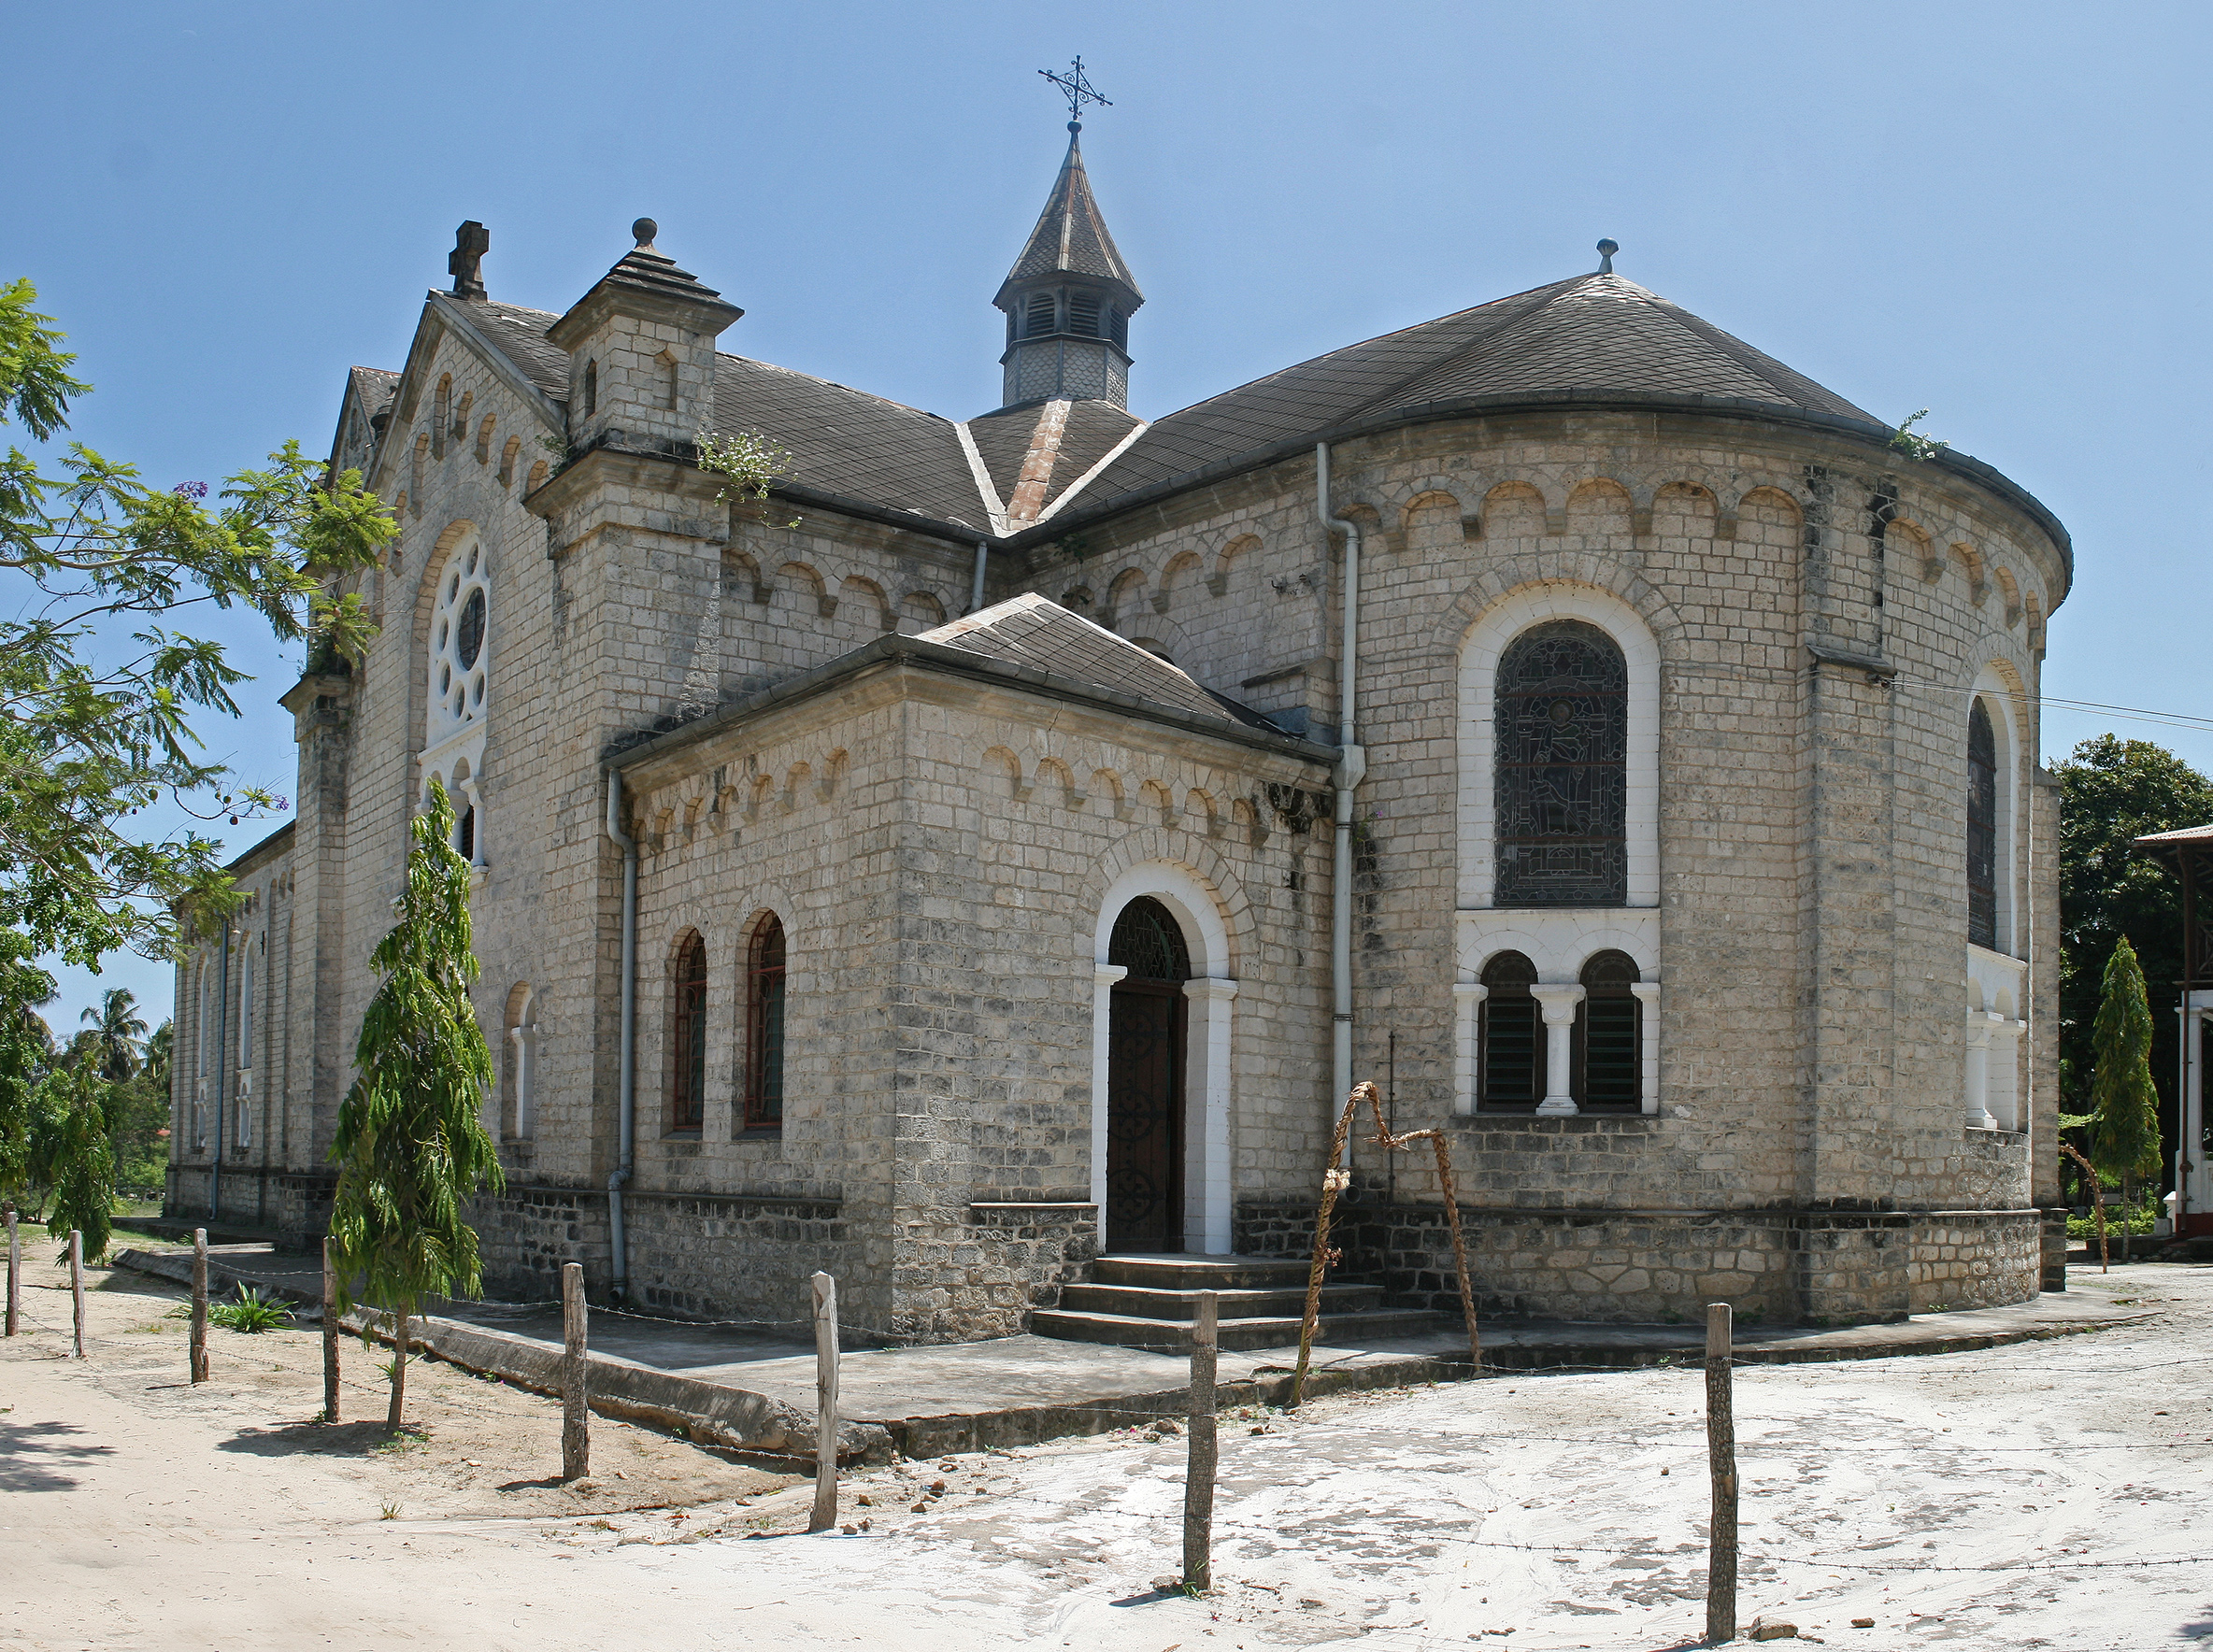
| Churches | 20 |
| Bars, pubs and taverns | 19 |
| Other accommodation | 15 |
| Public administration | 14 |
| Corporate management | 13 |
| Hardware store | 13 |
| Restaurants | 12 |
Kibaha Facts
| Area | 1804.1 km² |
| Population | 279,444 |
| Male Population | 136,977 (49.0%) |
| Female Population | 142,467 (51.0%) |
| Population change (1975 to 2020) | +662.5% |
| Population change (2000 to 2020) | +124.4% |
| Median Age | 21.4 years (Male: 21.4, Female: 21.5) |
| Area Codes | 23 |
| Neighborhoods | Kibamba, Kibaha Education Centre |
| Local Time | |
| Timezone | East Africa Time |
| Lat & Lng | -6.76667, 38.91667 |
Map of Kibaha
Interactive Map
Kibaha Population
Years 1975 to 2020
| Data | 1975 | 1990 | 2000 | 2015 | 2020 |
|---|---|---|---|---|---|
| Population | 36,647 | 78,235 | 124,511 | 244,284 | 279,444 |
| Population Density | 20.3 / km² | 43.4 / km² | 69 / km² | 135.4 / km² | 154.9 / km² |
Kibaha Population change from 2000 to 2015
Increase of 96.2% from year 2000 to 2015
| Location | Change since 1975 | Change since 1990 | Change since 2000 |
|---|---|---|---|
| Kibaha | +566.6% | +212.2% | +96.2% |
| Pwani Region | +186.7% | +90.3% | +47.7% |
| Tanzania | +234.9% | +110.2% | +57.4% |
Kibaha Median Age
Median Age: 21.4 years
| Location | Median Age | Median Age (Female) | Median Age (Male) |
|---|---|---|---|
| Kibaha | 21.4 yrs | 21.5 yrs | 21.4 yrs |
| Pwani Region | 19.7 yrs | 20.4 yrs | 19.1 yrs |
| Tanzania | 17.7 yrs | 18.2 yrs | 17.1 yrs |
Kibaha Population Density
Population Density: 155 / km²
| Location | Population | Area | Density |
|---|---|---|---|
| Kibaha | 279,444 | 1,804.1 km² | 155 / km² |
| Pwani Region | 1.3 million | 31,909.3 km² | 39.4 / km² |
| Tanzania | 53.2 million | 940,193.6 km² | 56.6 / km² |
Kibaha Historical and Projected Population
Estimated Population from 1830 to 2100
- JRC (European Commission's Joint Research Centre) work on the GHS built-up grid
- CIESIN (Center for International Earth Science Information Network)
- [Link] Klein Goldewijk, K., Beusen, A., Doelman, J., and Stehfest, E.: Anthropogenic land use estimates for the Holocene – HYDE 3.2, Earth Syst. Sci. Data, 9, 927–953, https://doi.org/10.5194/essd-9-927-2017, 2017.
Area Codes
Percentage Area Codes used by businesses in Kibaha
Price Distribution
Business distribution by price for Kibaha
Human Development Index (HDI)
Statistic composite index of life expectancy, education, and per capita income.
Kibaha CO2 Emissions
Carbon Dioxide (CO2) Emissions Per Capita in Tonnes Per Year
| Location | CO2 Emissions | CO2 Emissions Per Capita | CO2 Emissions Intensity |
|---|---|---|---|
| Kibaha | 74,957 tn | 0.27 tn | 41.5 tons/km² |
| Pwani Region | 328,373 tn | 0.26 tn | 10.3 tons/km² |
| Tanzania | 13,721,720 tn | 0.26 tn | 14.6 tons/km² |
| 2013 CO2 emissions (tonnes/year) | 74,957 tn |
| 2013 CO2 emissions (tonnes/year) per capita | 0.27 tn |
| 2013 CO2 emissions intensity (tonnes/km²/year) | 41.5 tons/km² |
Natural Hazards Risk
Relative risk out of 10
| Hazard | Risk Level |
|---|---|
| Drought | Low (2) |
| Flood | Medium (7) |
* Risk, particularly concerning flood or landslide, may not be for the entire area.
- Dilley, M., R.S. Chen, U. Deichmann, A.L. Lerner-Lam, M. Arnold, J. Agwe, P. Buys, O. Kjekstad, B. Lyon, and G. Yetman. 2005. Natural Disaster Hotspots: A Global Risk Analysis. Washington, D.C.: World Bank. https://doi.org/10.1596/0-8213-5930-4.
- Center for Hazards and Risk Research - CHRR - Columbia University, Center for International Earth Science Information Network - CIESIN - Columbia University, and International Research Institute for Climate and Society - IRI - Columbia University. 2005. Global Drought Hazard Frequency and Distribution. Palisades, NY: NASA Socioeconomic Data and Applications Center (SEDAC). https://doi.org/10.7927/H4VX0DFT.
- Center for Hazards and Risk Research - CHRR - Columbia University, Center for International Earth Science Information Network - CIESIN - Columbia University. 2005. Global Flood Hazard Frequency and Distribution. Palisades, NY: NASA Socioeconomic Data and Applications Center (SEDAC). https://doi.org/10.7927/H4668B3D.
Recent Nearby Earthquakes
Magnitude 3.0 and greater
| Date▼ | Time↕ | Magnitude↕ | Distance↕ | Depth↕ | Location↕ | Link |
|---|---|---|---|---|---|---|
| 6/10/11 | 8:28 AM | 4.8 | 86.7 km | 10,000 m | Tanzania | usgs.gov |
| 1/15/05 | 5:13 AM | 5 | 92.2 km | 10,000 m | Tanzania | usgs.gov |
| 6/9/97 | 2:38 AM | 4.4 | 64 km | 10,000 m | Tanzania | usgs.gov |
| 1/4/77 | 8:44 PM | 5.2 | 86 km | 33,000 m | Tanzania | usgs.gov |
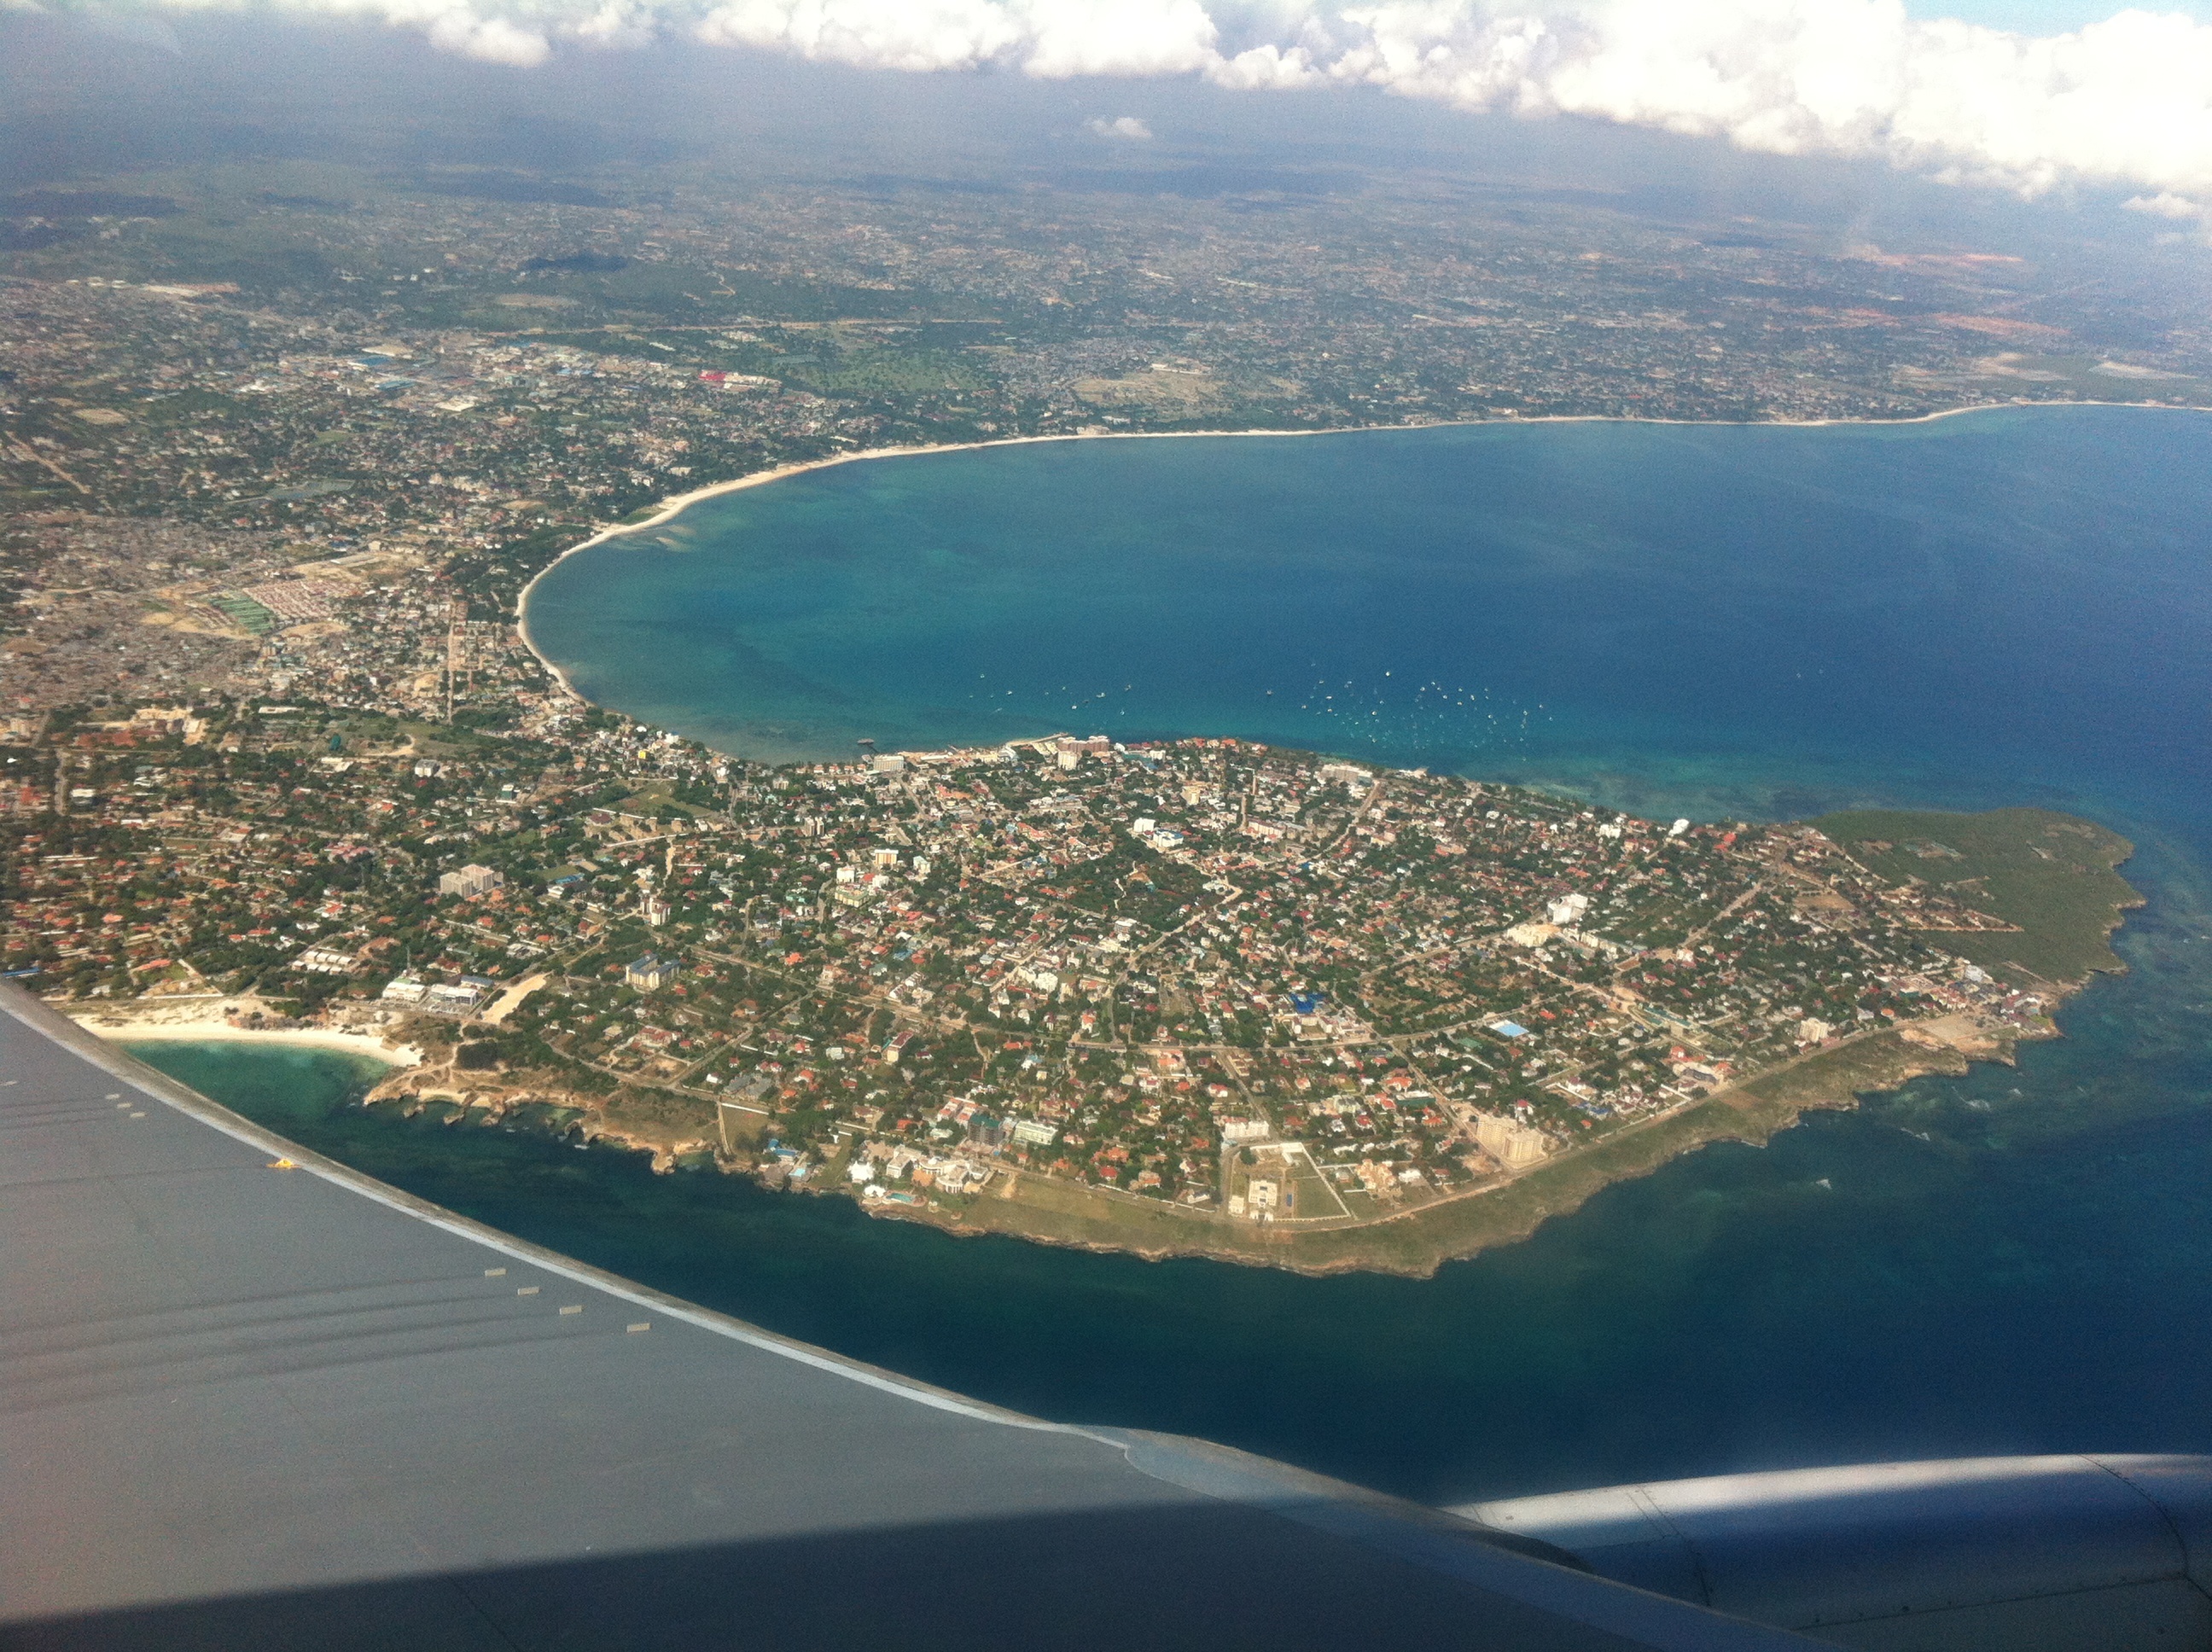
Kibaha
Kibaha is a city with 23050 inhabitants (2002) located in eastern Tanzania. It is the capital of Pwani Region. It is located in Kibaha District, one of the 6 districts of the Pwani Region.
Kibaha Wikipedia Page

About Our Data
The data on this page is estimated using a number of publicly available tools and resources. It is provided without warranty, and could contain inaccuracies. Use at your own risk.